Introduction
nixos-holochain runs a Holochain conductor, its hApps and the monitoring around them from a NixOS flake you write yourself. It was built at Sensorica for a room of five Holoports, and it is meant for anyone in the Holochain community who wants an edgenode they can read, change and roll back.
The gap it fills
Holochain has two deployment stories. Holonix gives developers a Nix environment, and it is mature. HolOS gives production edgenodes a Buildroot appliance image, which you flash and run but do not author. Nothing in between lets you describe a node declaratively and deploy it to commodity hardware.
These modules are that middle path. One nixos-rebuild brings up a conductor with its keystore, installs your hApps at boot, and, if you ask for it, exports the conductor’s own network metrics to a Prometheus and Grafana stack that ships with provisioned dashboards.
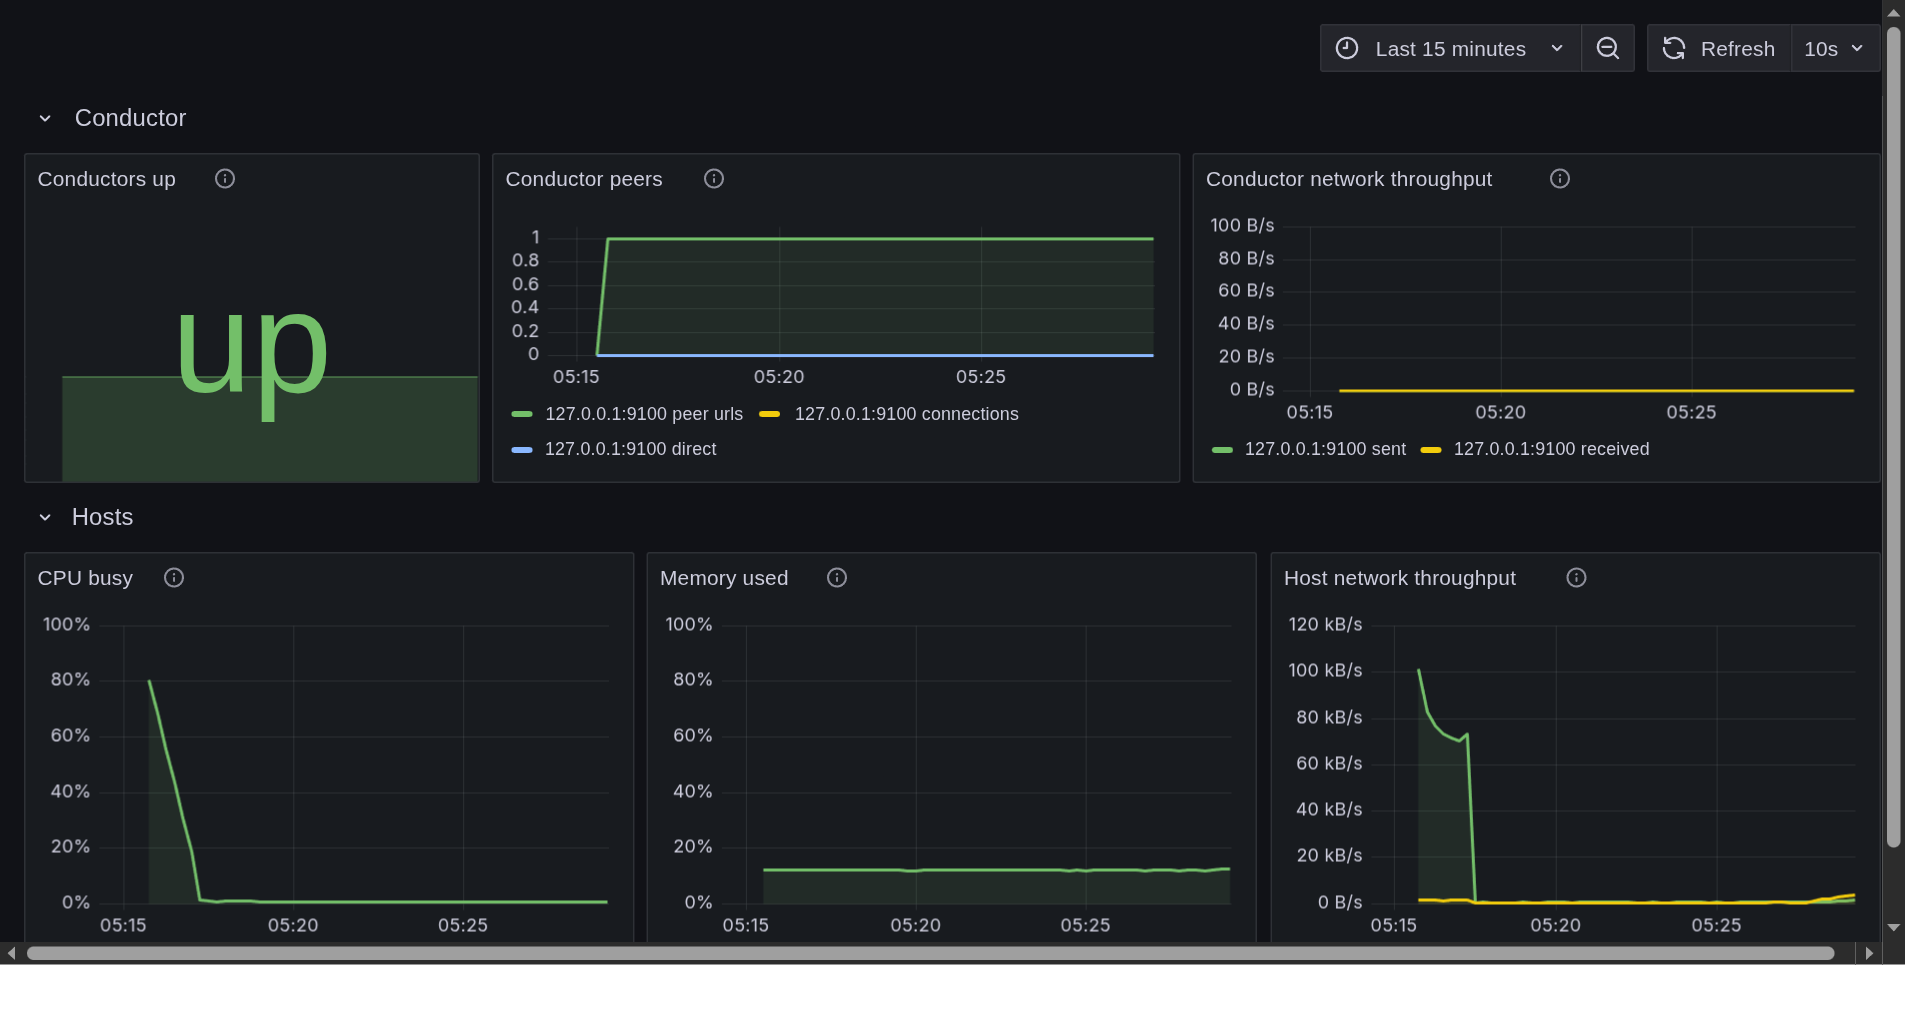
What is in the repository
-
Seven NixOS modules.
holochain-edgenodeis the core: conductor, in-process lair keystore, an idempotent hApp installer and optional metrics, on both the 0.7 and the 0.6 Holochain lines from one option set.holochain-grafanaadds Prometheus and Grafana for a fleet,holochain-http-gatewayserves chosen zome functions over HTTP,holochain-bootstrapruns your own bootstrap and relay server, andholochain-windtunnellends a machine to the Holochain Foundation’s test cluster, off by default.holochain-moss-noderuns a Moss group’s always-online node beside the edgenode, andsensorica-event-nodeis the Sensorica workshop’s profile (Holochain line, hApps and network seed) layered on it. -
Two flake templates.
nix flake init -t github:Sensorica/nixos-holochain#minimalwrites one edgenode;#fleetwrites five nodes with Grafana, a Colmena hive and a live ISO. -
A worked fleet.
examples/sensorica-fleetis the Sensorica Lab’s own flake: five Holoports, an operator desk and a workshop ISO. -
NixOS VM tests for every module, built in CI, so a claim in these pages about what a module does has a test behind it.
Where it stands
The modules work and are VM-tested on Holochain 0.7.0 and 0.6.3. The open work is hardware: deploying the full five-machine fleet to real Holoports is tracked in issues #8 to #12. The project is licensed MIT and succeeds the archived Sensorica/holoports-workshop.
Three ways through this book
You are installing a Holoport, at a workshop or as the operator of a fleet. Start with the Deployment guide, which walks a Holoport from an empty disk to a verified conductor, then read The Sensorica Lab fleet for how the lab’s machines are laid out. Workshop participants have a handout and a pre-flight checklist; facilitators have their own guide.
You run NixOS and want the modules on your own machines. Read the Architecture for how the conductor, the installer and the observability stack fit together, then keep the Module options reference open. Starting from a template gets a first node evaluating, hApp bundles covers where .happ files come from, and Moss always-online node runs a Moss group’s headless node.
You want to change the code. Contributing sets the rules: open an issue first, every new module ships a VM test, and the option reference is regenerated in the same commit as any option change. Releasing is how a version is tagged, and the architecture decision records are the design decisions behind the code. The archive records the December 2025 HolOS workshop this project grew out of.
Building this book
The book’s sources are the Markdown files under docs/, with docs/SUMMARY.md as the table of contents. From the repository root:
nix develop -c mdbook serve --open
Without the dev shell, nix shell nixpkgs#mdbook -c mdbook build writes the site to book/.
Deployment Guide
Prerequisites
- NixOS on the target machine(s)
- SSH access from the deployer to each node
- Nix flakes enabled (
experimental-features = nix-command flakesinnix.conf)
Single node
On a machine already running NixOS, start from the #minimal template in a directory you keep under git (a flake only sees tracked files):
mkdir edgenode && cd edgenode && git init
nix flake init -t github:Sensorica/nixos-holochain#minimal

# The placeholder hardware configuration only lets the flake evaluate; replace
# it with this machine's before switching, or the next boot looks for disks by
# labels this machine may not have.
sudo nixos-generate-config --show-hardware-config > hardware-configuration.nix

nano configuration.nix      # SSH key, hostname, hApps
git add flake.nix configuration.nix hardware-configuration.nix README.md
nix flake check --no-build
sudo nixos-rebuild switch --flake .#edgenode
The template boots with systemd-boot, as the NixOS installer does on UEFI; templates/minimal/README.md says what to change for legacy BIOS.
Colmena prerequisites
Before running colmena apply from examples/sensorica-fleet, each host must have:
- A real
hardware-configuration.nixreplacing the committed placeholder, generated on the target machine:sudo nixos-generate-config --show-hardware-config > examples/sensorica-fleet/hosts/sensorica-holoport-0N/hardware-configuration.nix - The facilitator’s SSH public key in
examples/sensorica-fleet/hosts/common.nixin theoperatorKeyslist at the top (used for thesensoricaaccount and for root, which Colmena connects as; public keys are committed, a flake never sees untracked files).
Fleet (Colmena)
cd examples/sensorica-fleet

# Deploy to all nodes in parallel (--impure: Colmena 0.4.0 cannot lock its
# `hive` input in pure mode, see examples/sensorica-fleet/README.md)
colmena apply --impure --on @all

# Deploy to a single node
colmena apply --impure --on sensorica-holoport-01

# Dry-run (shows what would change)
colmena apply --impure --dry-run
Workshop ISO
# Build the ISO
nix build ./examples/sensorica-fleet#nixosConfigurations.workshop-iso.config.system.build.isoImage

# Flash to USB (replace /dev/sdX with your USB device)
sudo dd if=result/iso/*.iso of=/dev/sdX bs=4M status=progress
sync
Installing on a Holoport (legacy BIOS)
A Holoport boots legacy BIOS only, so the NixOS graphical installer’s default UEFI layout does not boot on it. One script, scripts/holoport-install.sh, does the whole sequence of ADR-017: GPT with a 1 MiB bios_grub partition, a vfat ESP labelled boot, an ext4 root labelled nixos and 8 GiB of swap labelled swap at the end; root mounted at /mnt and the ESP at /mnt/efi-boot; nixos-install; then grub-install --target=i386-pc for the BIOS half. The same disk also boots on UEFI, because NixOS writes the EFI half from hosts/common.nix. The flake publishes the script as packages.x86_64-linux.holoport-install with every tool it calls pinned, and checks.x86_64-linux.vmTestHoloportInstall runs that package under SeaBIOS.
The script erases exactly the disk you name and nothing else. It refuses to run without one, shows that disk and the disks it will leave alone, and waits for you to type the disk’s name back. It also refuses when another disk already carries one of its three labels, because the installed system mounts by label.
The machines
| HoloPort | HoloPort+ | |
|---|---|---|
| CPU, RAM | dual-core Pentium 3.5 GHz, 8 GB | quad-core i7, 16 GB |
| Disks | 1 TB HDD at /dev/sda | 128 GB SSD at /dev/sda, 2 TB HDD at /dev/sdb |
| Install on | /dev/sda | /dev/sda (the SSD); /dev/sdb stays as it is |
Both have Ethernet and no Wi-Fi, HDMI and a USB keyboard, no DMI data, and legacy BIOS. On the base HoloPort, tapping Esc at power-on opens the firmware boot menu; pick the stick there, because the GRUB menu on the internal disk belongs to HoloOS and never lists it. The key for the BIOS setup, and the HoloPort+’s keys, are not known yet: try Del or F2 for setup, and F7, F8, F11 or F12 for the boot menu.
1. Boot an installer and get network
Write the workshop ISO (above) or the stock NixOS 26.05 minimal ISO to a USB stick with dd, plug the Holoport into the lab router with Ethernet, and boot the stick from the boot menu. Use a USB 2 port: from a USB 3 port the base HoloPort’s live system fails with SQUASHFS error: Unable to read page and freezes. Prefer a text console to a graphical ISO, whose desktop freezes on the base HoloPort’s Intel HD 610; if you booted one and it froze, Ctrl+Alt+F1 then Ctrl+Alt+F3 reaches a console logged in as nixos, and sudo systemctl stop display-manager stops the frozen session. Then, in a root shell (sudo -i on either ISO):
ip -br -4 a
nix --extra-experimental-features nix-command store info --store https://cache.nixos.org
lsblk -d -o NAME,SIZE,ROTA,MODEL
The first line shows the address the router gave the box; the second prints Store URL: https://cache.nixos.org once the binary cache is reachable; the third confirms which disk is which before anything is erased.
2a. Install from the Holoport itself
Nearly everything is downloaded rather than built: packages come from cache.nixos.org and from the Holochain cache, which the script passes to nixos-install since the target has no nix.conf yet; only small derivations such as the unpacked Requests & Offers bundle and the configuration files are built on the box. Clone the repository, put your SSH public key in the operatorKeys list at the top of examples/sensorica-fleet/hosts/common.nix, then run the script against your checkout:
git clone https://github.com/Sensorica/nixos-holochain /root/nixos-holochain
cd /root/nixos-holochain
nano examples/sensorica-fleet/hosts/common.nix
nix --extra-experimental-features 'nix-command flakes' run --accept-flake-config .#holoport-install -- /dev/sda ./examples/sensorica-fleet#sensorica-holoport-01
Type /dev/sda when it asks. It asks once more at the end, for a root password for the console, but only when it runs in a terminal: nixos-install skips that prompt when its input is not one (a background or piped SSH session), and then passwd, run in the shell nixos-enter --root /mnt opens, sets it before the reboot. On the base HoloPort, with its slow disk and two cores, expect this to take a while; path 2b moves the work to a laptop.
Before the first boot, keep the checkout (with your key) on the installed disk. The Sensorica fleet rebuilds from /etc/nixos-holochain, owned by root and the wheel group so the sensorica operator can edit it:
install -d -m 2775 -g wheel /mnt/etc/nixos-holochain && cp -a /root/nixos-holochain/. /mnt/etc/nixos-holochain/ && chgrp -R wheel /mnt/etc/nixos-holochain && chmod -R g+rwX /mnt/etc/nixos-holochain && git -C /mnt/etc/nixos-holochain config core.sharedRepository group
2b. Install from a laptop
The laptop builds the system and copies it straight onto the Holoport’s new root partition over SSH, so the Holoport only partitions, receives and writes the boot loader. The laptop needs the Holochain cache in its own nix.conf (see Trying it without hardware), or it compiles the conductor.
On the laptop, from a checkout with your key already in operatorKeys:
nix build ./examples/sensorica-fleet#nixosConfigurations.sensorica-holoport-01.config.system.build.toplevel --out-link sensorica-holoport-01-system
On the Holoport, give root a password for the installer session and start its SSH server (the installer ships one but does not start it):
passwd
systemctl start sshd
Back on the laptop, with HOLOPORT_IP being the address from step 1, send your key, then start the install over SSH:
ssh-copy-id root@HOLOPORT_IP
ssh -t root@HOLOPORT_IP "nix --extra-experimental-features 'nix-command flakes' run --accept-flake-config github:Sensorica/nixos-holochain#holoport-install -- /dev/sda $(readlink -f sensorica-holoport-01-system)"
The script partitions the disk, sees that the system is not on the Holoport yet, prints the exact nix copy command and waits. Run it in a second terminal on the laptop; it has this shape:
nix copy --to "ssh://root@HOLOPORT_IP?remote-store=/mnt" "$(readlink -f sensorica-holoport-01-system)"
remote-store=/mnt writes into the new root partition rather than the installer’s own store, which lives in RAM and is too small for the event node’s closure (about 10 GiB, most of it the desktop). The script carries on by itself once the copy lands.
3. Before the first boot
/mnt is still mounted when the script ends. sensorica-holoport-01 runs Grafana with its admin password read from a file, which has to exist before Grafana first starts; NEW_PASSWORD is the one you choose. It also runs the Moss node, whose conductor password is read from a file too: without it moss-node.service fails with status=243/CREDENTIALS, retries every 30 s, and the machine reads “A service is down”. The systemd-ask-password line asks for a new Moss conductor password and writes it with no trailing newline:
install -d -m 0700 /mnt/var/lib/secrets
install -m 0400 /dev/null /mnt/var/lib/secrets/grafana-admin-password
printf '%s' 'NEW_PASSWORD' > /mnt/var/lib/secrets/grafana-admin-password
printf '%s' "$(systemd-ask-password 'Moss conductor password:')" | install -m 0400 /dev/stdin /mnt/var/lib/secrets/moss-node-password
umount -R /mnt && swapoff -a && reboot
Remove the USB stick while the Holoport restarts. It boots from its disk through the BIOS GRUB.
4. Verify
On the Holoport, or over SSH as sensorica or root with the key from operatorKeys:
systemctl is-active holochain-conductor moss-node
systemctl status holochain-happ-installer
journalctl -u holochain-happ-installer --no-pager | grep 'Enabled app'
curl -s -u "admin:NEW_PASSWORD" 'localhost:3000/api/search?query=Holochain'
The first boot compiles three hApps, so holochain-happ-installer can take several minutes to finish on a Holoport (about a minute in the VM check). The conductor and the Moss node should each answer active; the journal should end with hc-sandbox: Enabled app: "hrea", "kando" and "requests-and-offers"; and the last line should list the dashboards whose titles name Holochain, among them the fleet page, Which Holochain node needs attention? Grafana is also at http://HOLOPORT_IP:3000 from a laptop on the same network, where it opens on What is this machine running? Verifying the deployment has the metrics checks.
The Moss node hosts no group until it joins one. Once per machine, as root on the Holoport, run moss-node join "INVITE_LINK" with an invite from the Sensorica group in Moss, starting the line with a space so the link stays out of shell history, as described in Moss always-online node; moss-node status then lists the group.
Rescuing an install from another machine
When the graphical installer fails on a machine in front of you (a Holoport, a homelab box), take it over from a laptop on the same network instead of debugging at its console. Every step below was run on 2026-09-26, rescuing a homelab install of NixOS 26.05.
Making the USB stick
Write the ISO directly to the stick and check it byte for byte. Do not boot a NixOS 26.05 ISO through Ventoy: the initrd waits for the ISO’s filesystem label (/dev/disk/by-label/nixos-graphical-26.05-x86_64), Ventoy never exposes it, and the boot drops to emergency mode. Ventoy’s GRUB2 mode (Ctrl+R) did not help either.
sudo dd if=nixos-graphical-26.05-x86_64-linux.iso of=/dev/sdX bs=4M status=progress conv=fsync
sudo cmp -n "$(stat -c %s nixos-graphical-26.05-x86_64-linux.iso)" nixos-graphical-26.05-x86_64-linux.iso /dev/sdX && echo VERIFIED
dd returns only once conv=fsync has flushed everything, which on a slow stick is minutes after the copy counter reaches 100%. A red Failed to start Load Kernel Modules during the live boot is harmless when the boot carries on.
Letting the laptop in
The stock installer ships an SSH server but does not start it, and its nixos user has no password. On the machine, in a terminal of the live session:
passwd
sudo systemctl start sshd
ip -br -4 a
On the laptop, with the address from the last command (it asks for that password once):
ssh-copy-id -o StrictHostKeyChecking=accept-new nixos@<machine-ip>
If nobody can read the address off the screen, find it from the laptop: on a home network, the installer is usually the only host answering on port 22. Replace 192.168.0 with your network’s prefix.
for i in $(seq 1 254); do (timeout 1 bash -c "echo > /dev/tcp/192.168.0.$i/22" 2>/dev/null && echo 192.168.0.$i) & done; wait
The workshop ISO (examples/sensorica-fleet, hosts/workshop-iso) enables services.openssh but ships an empty authorizedKeys list; putting the facilitator’s key there would remove the passwd and ssh-copy-id steps. Whether its sshd starts at boot has not been checked yet (the upstream installer module keeps sshd out of multi-user.target); tracked with the ISO work in #6.
Reading why the installer failed
The graphical installer (Calamares) logs everything, including nixos-install’s output, to a root-only file:
ssh nixos@<machine-ip> 'sudo grep -a -n -E "error|onInstallationFailed|Starting job" /root/.cache/calamares/session.log | tail -30'
lsblk -f shows whether the partitions were created. A failed run leaves them mounted under /tmp/calamares-root-*, with swap active; the installer then offers only manual partitioning.
Known failure: downloads fail “after 0 ms”
Symptom: nixos-install stops on unable to download 'https://cache.nixos.org/…narinfo': Could not connect to server … after 0 ms. Seen on a home router whose DNS answered the installer with an IPv6 address only (getent ahostsv4 cache.nixos.org empty) while the machine had no IPv6 route. Check and fix in the live session:
getent ahostsv4 cache.nixos.org
c="$(nmcli -g GENERAL.CONNECTION device show <iface>)"; sudo nmcli con mod "$c" ipv4.dns "1.1.1.1 9.9.9.9" ipv4.ignore-auto-dns yes && sudo nmcli con up "$c"
nix --extra-experimental-features nix-command store info --store https://cache.nixos.org
<iface> is the Ethernet interface from ip -br -4 a (enp0s31f6 on the homelab). The connection name is looked up rather than typed because it follows the installer’s language: “Wired connection 1” in English, “Connexion filaire 1” in French. On an installed system, a user in the networkmanager group can run the two nmcli commands without sudo. The last line prints Store URL: https://cache.nixos.org once the cache is reachable. The installed system asks the same router for DNS, so set networking.nameservers in its configuration (or fix the router) before its first nixos-rebuild.
Retrying
Release what the failed run left behind, then relaunch the installer and choose to erase the disk:
for m in $(findmnt -rn -o TARGET | grep calamares-root | sort -r); do sudo umount "$m"; done
sudo swapoff -a
Trying it without hardware
The root flake ships a single-node configuration so you can run the module on a laptop before touching a Holoport:
nixos-rebuild build-vm --flake .#minimal-vm
./result/bin/run-*-vm
# at the console (autologin as root):
systemctl is-active holochain-conductor
nixos-rebuild is absent on non-NixOS hosts (a Linux laptop with plain Nix, or a NixOS container). The same VM is reachable through the flake output it wraps:
nix build .#nixosConfigurations.minimal-vm.config.system.build.vm
./result/bin/run-*-vm
A host that imports the holochain-edgenode module gets the Holochain Foundation’s binary cache in its nix.settings (services.holochain-edgenode.binaryCache.enable, on by default), so holochain and hc download prebuilt. That setting reaches nix.conf only once a switch has activated it: the first nixos-rebuild switch that brings the module still compiles Holochain from source (the cargo-src-* and holochain-deps derivations are the sign) unless you pass the cache for that one run:
sudo nixos-rebuild switch --flake .#<host> --option extra-substituters https://holochain-ci.cachix.org --option extra-trusted-public-keys holochain-ci.cachix.org-1:5IUSkZc0aoRS53rfkvH9Kid40NpyjwCMCzwRTXy+QN8=
Every later switch uses the plain command. This root flake also declares the cache in its nixConfig, for building its own outputs, but Nix only honours that with your consent. If you see
warning: ignoring untrusted flake configuration setting 'extra-substituters'.
Pass '--accept-flake-config' to trust it
then the conductor is about to be built from source, which takes hours. Pass --accept-flake-config, or add the substituter to your own nix.conf:
extra-substituters = https://holochain-ci.cachix.org
extra-trusted-public-keys = holochain-ci.cachix.org-1:5IUSkZc0aoRS53rfkvH9Kid40NpyjwCMCzwRTXy+QN8=
The first boot is not fast even so: the conductor takes a minute or more to open its admin port on a VM, and installing a hApp is slower still.
Seeing the dashboards before deploying a fleet
observability-vm is the whole observability stack on one machine: an edgenode exporting its conductor’s holochain_* series, plus Prometheus and Grafana scraping and drawing them. Grafana and Prometheus are forwarded to the host, so a real browser reaches them.
nixos-rebuild build-vm --flake .#observability-vm
./result/bin/run-observability-vm-vm
# or, on a non-NixOS host:
nix build .#nixosConfigurations.observability-vm.config.system.build.vm
./result/bin/run-observability-vm-vm
Then open http://localhost:13000 (admin / workshop2026). Grafana’s home page is What is this machine running?, opened on the machine Grafana runs on; Prometheus itself is on http://localhost:19090. Give it a couple of minutes: the conductor needs a minute or more to come up, the metrics timer fires every 10 seconds in this VM, and the panels need a few points before they draw a line.
Five dashboards ship, all tagged holochain, each titled with the one question its reader asks, and each linking to the others:
| Dashboard (uid) | Reader | What it answers |
|---|---|---|
What is this machine running? (holochain-home) | Anyone opening Grafana: it is the home page, on the machine Grafana runs on, with a node picker for any other | The machine in words (state, host name, NixOS release, kernel, uptime, processor, memory and fullest disk); every service it runs, worst first, with its state, the version of what it runs and when it last started; each Holochain conductor with the service that runs it, its Holochain version and whether it answers; each app on them in the six words; and links to the other pages and, where there is one, the Moss page |
Is the Holochain network working? (holochain-now) | The room, on a shared screen (add ?kiosk to the URL) | Are the readings current, which machines are on, is each app working on each machine and connected to how many others, did the latest write in the room’s app reach every machine, and how long since each app last heard from anyone |
Which Holochain node needs attention? (holochain-fleet) | Whoever runs the fleet | How many machines are unreachable, conductors silent or stale, app parts cut off or behind, machine problems; one row per machine, worst first; the problems in words; the watched services that are down; the app matrix; each machine’s status over time; and a collapsed Machines row |
Is this node working, app by app? (holochain-node) | An operator with one machine, or anyone following a link from the fleet page | Each conductor on the machine, its apps, and one row per app part: its state, other computers, the share of its best peer’s data it holds, when it last heard from anyone, what it is still fetching; every service the machine runs, by name, with its state; then the machine itself in collapsed rows |
Is this app in step on every node? (holochain-network) | The facilitator asked “did my message reach the others?”, or the operator after a Lost contact | One app network across every machine: how many run it, whether any is cut off or behind, a step chart of the data each holds, and each machine’s status over time |
Every app part reads one of six words, worst first: Not running, No fresh readings, Lost contact, No one else yet (grey, and normal for a machine alone), Catching up and In step. The room and fleet pages explain each in a sentence at the bottom. They are computed once, by the recording rules of modules/holochain-rules.nix, so no two pages can disagree; a machine reads by its worst conductor, and an app by its worst part. No page shows a hash, an installed app id or a scrape address, except the collapsed “For bug reports” row of the network page, which exists to be pasted into an issue.
Each machine lists the services it runs, from the modules enabled on it: the conductor, the app installer, the readings timer, the HTTP gateway, the local bootstrap and relay, the Wind Tunnel runner, Prometheus and Grafana on the monitor, and beside them node_exporter, sshd, Tailscale and the Nix daemon when they are enabled. The home page lists them by name with their state, the version of the package each runs (from Nix, a dash where a unit declares none) and when each last started; the node page lists them by name with their state; the fleet page lists the ones that are not running; a machine’s tile on the room screen reads “A service is down” while one has failed, keeps failing and restarting, has stopped or does not answer. The table of every service and where its name and state come from is in architecture.md. A machine needs node_exporter’s textfile collector for its list to reach the pages; an edgenode and a monitor have it already.
Two options feed the pages. overviewUnits, on the monitor, adds units to watch on every machine that runs them, with the name a person reads for each: overviewUnits = { "caddy.service" = "Web server"; }; (a list, [ "caddy.service" ], still works and shows the unit name). A service of your own on one machine goes in that machine’s own list instead: services.holochain-services.units."caddy.service" = "Web server";. room (app, part, label) picks the one app part whose writes the room screen follows; left unset, that chart says so. Temperatures are empty in this VM and on any machine without hardware sensors; that is expected.
The thresholds behind the words (readings older than 90 s, 10 minutes without contact, 95% of the best peer’s data) are services.holochain-grafana.states. The provisioned dashboards follow them: every colour step that stands for a state threshold, and every sentence that quotes one, is rewritten from the option on its way into the store. A dashboards directory outside the store is not rewritten, so it keeps the defaults.
The dashboards are provisioned, not saved by hand. Editing one in the browser will appear to work and will be discarded on the next rebuild; change the JSON in modules/dashboards/ instead, and run checks.dashboardLabels and checks.dashboardQueries.
First boot sequence
- NixOS boots.
holochain-conductor.servicestarts (waits for network). ItspreStartgenerates/var/lib/holochain/lair-passphrase(mode 0600) if it is not already there, and the conductor reads it over--piped. Nothing is prompted and nothing is stored in the Nix store.- The unit is
Type = notify, so it becomes active when the conductor reports readiness rather than when the process starts. On slow or unaccelerated hardware this takes a minute or more;TimeoutStartSecis 600s. holochain-happ-installer.serviceinstalls and enables the configured hApps, then attaches the app WebSocket.- The conductor is reachable on
adminPort(default 4444) andappPort(default 8888), both bound to localhost.
Every boot after the first runs the same sequence. The installer is idempotent: it skips install-app for apps already present, re-runs enable-app unconditionally, and only attaches the app WebSocket if it is not already attached. The passphrase persists in the state directory, so the keystore opens again with nobody present.
Verifying the deployment
# Conductor status
systemctl status holochain-conductor

# Follow conductor logs
journalctl -u holochain-conductor -f

# Check hApp installer ran
systemctl status holochain-happ-installer
journalctl -u holochain-happ-installer

# Conductor metrics (metricsExporter.enable + conductorMetrics.enable)
systemctl list-timers holochain-conductor-metrics
curl -s localhost:9100/metrics | grep '^holochain_'
holochain_conductor_up{conductor="Holochain"} 0 means the timer is running and the conductor is not answering; check journalctl -u holochain-conductor. The conductor label is conductorMetrics.name. No holochain_ lines at all means the timer has not fired yet, or conductorMetrics.enable is off. A node_textfile_scrape_error of 1 with another conductor’s textfile in the same directory (a Moss node, say) means the two files declare a family differently: both must be written by holochain-conductor-exporter, and node_exporter’s log names the family.
Each DHT the conductor is in has its own holochain_dht_* series, labelled with the conductor, the installed app id (app_id), the role and the DNA hash, and one holochain_dht_info line that names it for dashboards (see Names):
# one line per cell of every enabled app
curl -s localhost:9100/metrics | grep '^holochain_dht_peers'
# the same DHTs as the conductor reports them
hc sandbox call --running 4444 dump-network-metrics --include-dht-summary   # 0.6 line
hc client call --port 4444 dump-network-metrics --include-dht-summary       # 0.7 line
A node alone on its network shows holochain_dht_peers 0 and holochain_dht_seconds_since_gossip -1 for every DHT. No holochain_dht_ lines while holochain_conductor_apps{status="enabled"} is above zero means dump-network-metrics did not answer, or answered in a shape the exporter does not read. The second case is logged in journalctl -u holochain-conductor-metrics; the first leaves no trace there, so run the call above by hand. A cell whose DNA the reply does not list gets no series rather than zeros.
On the monitor node:
# every configured scrape target should be "health":"up"
curl -s localhost:9090/api/v1/targets | jq '.data.activeTargets[] | {scrapeUrl, health, lastError}'

# the five provisioned dashboards should be there, six where the Moss page is
# export GRAFANA_ADMIN_PASSWORD first; on a node that kept the module
# default it is the workshop password
curl -s -u "admin:$GRAFANA_ADMIN_PASSWORD" 'localhost:3000/api/search?tag=holochain' | jq -r '.[].uid'

# every node by name, with its state (4 is Running, 2 A service is down)
curl -s --get localhost:9090/api/v1/query \
  --data-urlencode 'query=holochain:node_state' \
  | jq '.data.result[] | {node: .metric.node, state: .value[1]}'

# what the problem lists say, one sentence per problem
# (failed units, mount units included, full disks, silent conductors)
curl -s --get localhost:9090/api/v1/query \
  --data-urlencode 'query=holochain:node_problem' \
  | jq '.data.result[] | {node: .metric.node, problem: .metric.problem}'
A node missing from the second answer is not scraped (check the targets above). The third answer is empty on a healthy fleet; each entry names what to look at, a failed unit with systemctl status on that node.
Running your own bootstrap and relay
By default every edgenode uses the Holochain Foundation’s development bootstrap server and the iroh canary relay, which need the internet and which the Foundation says are not for production hApps. The holochain-bootstrap module runs the same service on one of your own machines: kitsune2-bootstrap-srv, a single binary that answers peer discovery at /bootstrap/{space} and relays iroh traffic at /relay, on one TCP port. A fleet on a LAN with no uplink can then still find itself.
On the machine that serves it (a Holoport, say), in its NixOS configuration:
imports = [nixos-holochain.nixosModules.holochain-bootstrap];
services.holochain-bootstrap = { enable = true; openFirewall = true; };
That listens on TCP 443 over plain HTTP and on UDP 7842 for QUIC address discovery. The server keeps nothing on disk: its agent list lives in the unit’s private /tmp and empties on restart, and conductors re-publish on their own within minutes. Run one server per network; two instances do not share state.
On every edgenode, the three options that point it there (bootstrap-host stands for that machine’s name or LAN address):
services.holochain-edgenode = { bootstrapUrl = "http://bootstrap-host:443"; relayUrl = "http://bootstrap-host:443/relay"; relayAllowPlainText = true; };
relayAllowPlainText is required for an http:// relay: the conductor refuses one without it, and the module fails evaluation rather than ship a conductor that will not start. All nodes that should see each other must use the same bootstrap server.
Check it from any node:
curl -sf http://bootstrap-host:443/health
On the dashboards the server is “Local bootstrap and relay”, among the services of the machine that runs it. A timer asks its /health every 30 seconds, so a server that runs and does not answer reads Not answering, not Running, and turns that machine’s tile on the room screen to A service is down. This needs node_exporter’s textfile collector on that machine: an edgenode or a monitor has one; on a machine that runs only the server, point services.holochain-services.textfileDirectory at the directory its node_exporter reads.
journalctl -u holochain-bootstrap -f
To see the other agents a conductor learnt about, on a 0.6 node (hc client call --port 4444 on 0.7):
hc sandbox call --running 4444 list-agents
Each entry’s url should start with http://bootstrap-host.:443/relay/; iroh writes the host with a trailing dot.
Two limits, stated plainly.
-
No TLS means no Moss laptops. Without
tlsCertFileandtlsKeyFilethe server is plain HTTP. Fleet conductors accept that throughrelayAllowPlainText; a packaged Moss 0.15.8 desktop does not, since Moss turns that flag on only in development builds. A laptop joining through this server needs it on HTTPS with a certificate the laptop trusts, which on a LAN without a public domain means your own CA installed on every laptop. The module takes the files (tlsCertFile,tlsKeyFile, read through systemd credentials, so they stay out of the Nix store) but this repository has not tested a TLS setup. -
The relay is open. Anyone who can reach the port can relay traffic through it; the server has no authentication by default. Keep it on the LAN, or behind a firewall, unless that is what you want.
Keep the server on the same Holochain line as the conductors. The module defaults to the 0.6 build (kitsune2 0.4.1, nixos-holochain.packages.<system>.bootstrap-srv-0_6); a 0.7 fleet sets package = nixos-holochain.packages.<system>.bootstrap-srv (kitsune2 0.5.0).
Cost, measured in the vmTestBootstrap VM (one vCPU, 1 GiB, kitsune2 0.4.1 with the module’s defaults, so four worker threads and nine threads in all) on 2026-09-27. RSS from ps, CPU from the unit’s CPUUsageNSec:
| Phase | RSS | cgroup memory peak | CPU |
|---|---|---|---|
| Idle, no conductor, 30 s | 5.9 MiB | 7.2 MiB | 0.005 % of one core (2 ms) |
| Two conductors booting until each holds the other’s agent info, 36 s | 7.7 MiB | 9.2 MiB | 0.08 % (29 ms) |
| Two conductors connected, 60 s | 7.7 MiB | 9.2 MiB | 0.02 % (10 ms) |
Next to a conductor’s gigabyte this is noise, so one Holoport can carry the server beside its own edgenode. Two peers say nothing about a room of fifty; that number is for the lab.
Rolling back
# Roll back to the previous NixOS generation
sudo nixos-rebuild switch --rollback

# List all generations
sudo nix-env --list-generations --profile /nix/var/nix/profiles/system
Sensorica Lab fleet
The worked example behind the nixos-holochain modules: five Holochain edgenodes for the Sensorica Lab workshop, sensorica-holoport-01 doubling as the Grafana monitor node, plus the live ISO participants boot from. It is its own flake so that evaluating the module repository never evaluates Sensorica’s machines; copy this directory to start your own fleet.
Layout
examples/sensorica-fleet/
├── flake.nix                      # inputs, the five nixosConfigurations, the ISO, the colmena hive, the parity check
├── hosts/
│   ├── common.nix                 # shared by every host: user, SSH keys, desktop, never-sleep, rebuild alias, edgenode service
│   ├── desk.nix                   # the operator desk: launchers, Plasma layout, tools, Avahi, event mode
│   ├── sensorica-holoport-01/
│   │   ├── configuration.nix      # monitor node: adds Grafana/Prometheus and the Moss node
│   │   └── hardware-configuration.nix   # placeholder, replace per machine (below)
│   ├── sensorica-holoport-02 … 05/          # peer nodes: hostname + hardware only
│   └── workshop-iso/configuration.nix   # KDE Plasma live ISO with the repo cloned on boot
└── README.md
Host names
The five machines are sensorica-holoport-01 to sensorica-holoport-05, and each flake output carries its hostname. A NixOS Holoport runs more than a Holochain edgenode (a Moss node, Grafana, a bootstrap server), so the machine is named for what it is and the edgenode stays a role. sensorica-holoport-01 is the monitor node: Grafana and Prometheus for the whole fleet, and the Sensorica Moss group’s always-online node. 02 to 05 are peer nodes, hostname and hardware only.
Which nixos-holochain the fleet reads
flake.nix pins nixos-holochain to github:Sensorica/nixos-holochain, the main branch, and flake.lock records the commit. The Holoports install from main too: a fresh clone of it needs only the operator key (below) before the install.
Holoports installed before 2026-09-28 came from the lab/holoport-session branch, which is now merged into main. Their /etc/nixos-holochain checkout still has the lab branch checked out, with the operator key as a local commit on top. Switch it to main once, keeping that commit:
git -C /etc/nixos-holochain fetch origin
git -C /etc/nixos-holochain checkout -B main
git -C /etc/nixos-holochain rebase origin/main
git -C /etc/nixos-holochain branch --set-upstream-to=origin/main
checkout -B main puts the name main on the commit the checkout is on now, the operator key included, and switches to it. rebase origin/main then replays only the commits origin/main does not have, which is the operator key commit, since every lab commit is already in main. The last line makes main track origin/main, so the next git -C /etc/nixos-holochain pull --rebase follows main. git -C /etc/nixos-holochain log --oneline origin/main..main should now print the operator key commit and nothing else; run rebuild afterwards.
Rebuilding a Holoport
Every Holoport has a rebuild alias, for root and for sensorica:
rebuild
It runs sudo nixos-rebuild switch --flake /etc/nixos-holochain/examples/sensorica-fleet, from the checkout the install leaves in /etc/nixos-holochain (root and the wheel group, so sensorica can edit it from the desk); the output matching the hostname is picked without a fragment. It does not pull: that checkout carries the operator key as a local commit, so updating it is a separate git -C /etc/nixos-holochain pull --rebase. Only one switch can run at a time; a second one fails with “nixos-rebuild-switch-to-configuration.service was already loaded” and changes nothing.
A Holoport never sleeps
hosts/common.nix disables the sleep, suspend, hibernate and hybrid-sleep targets, so no desktop, logind idle action or key can suspend a Holoport. Plasma’s power management suspended sensorica-holoport-01 from its login screen on 2026-09-27 and took its conductors and dashboards with it; systemctl start suspend.target now answers that the unit is masked.
Switches, per Holoport
Each hosts/sensorica-holoport-0N/configuration.nix opens with a switches block. Change a value in a text editor (Kate on the desk, nano over SSH), save, run rebuild. No other file needs to change, and every earlier generation stays in the boot menu, so sudo nixos-rebuild switch --rollback undoes a switch that goes wrong.
| Switch | Values | What it does |
|---|---|---|
sensorica.desktop | "plasma" (default), "gnome", "none" | KDE Plasma with the operator panel, GNOME with the same launchers in the dock, or no graphical session at all (text console and SSH). The node’s services run the same either way. |
sensorica.eventMode.enable | false (default), true | Logs in without a password and opens the room dashboard full screen at boot. Needs a desktop. |
services.holochain-edgenode.enable | true (default), false | The Holochain conductor and the event’s hApps. |
sensorica.remoteAccess.enable | false (default), true | Joins Sensorica’s tailnet through Headscale at https://hs.sensorica.co (hosts/remote-access.nix), so SSH, Grafana and rebuild reach the Holoport from outside the lab. Before switching it on, write a pre-auth key from headscale preauthkeys create to /var/lib/secrets/headscale-authkey (root only). |
sensorica-holoport-01 also enables Grafana (services.holochain-grafana) and the Moss node (services.holochain-moss-node) further down its file; enable = false on either turns it off.
The operator desk
hosts/desk.nix is what a person at a Holoport’s own screen gets when they log in as sensorica. It is self-contained on purpose: copy the file and its two inputs (home-manager release-26.05 and plasma-manager, both in this flake only; the modules stay desktop-free) to give another NixOS machine the same kind of desk.
- One Grafana entry, on the desktop and in the panel, that opens Grafana’s home page on this Holoport: what it runs, with links to the fleet, node, network and Moss pages.
- Launchers pinned to the panel (the dock on GNOME) and in the menu under System: Grafana, Holochain logs (the conductor’s journal), Moss node logs (on the host that runs one) and Rebuild, then Konsole and Dolphin.
- On Plasma, a session declared with plasma-manager: that bottom panel on every screen, a CPU and RAM monitor, the tray and the clock; Breeze Dark; no screen lock and no suspend or display-off on AC. The layout is applied at the next login. On GNOME, the same no-lock, no-blank settings through dconf.
tmux,btopand the Holochain 0.6hcon PATH, whichever desktop.- Avahi, so
sensorica-holoport-01.localresolves on every Holoport and laptop in the lab without a DNS server. The launchers reach Grafana throughsensorica.grafanaUrl,http://sensorica-holoport-01.local:3000by default, and open on its login page.
Event mode, off by default and set per host:
sensorica.eventMode.enable = true;
It logs sensorica in without a password and opens the room dashboard full screen (Firefox in kiosk mode on the holochain-now page) at every boot. On the monitor node it also lets Grafana show dashboards to anonymous viewers with the Viewer role, so the screens need no login; the admin login is unchanged. Turn it on for the day of an event and off again after.
The Moss node
sensorica-holoport-01 hosts the Sensorica Moss group’s always-online node through nixos-holochain.nixosModules.holochain-moss-node, which every host imports and only 01 enables. docs/moss-node.md in the module repository describes the service. Two steps per machine, once, both at a terminal as root: write the conductor password to /var/lib/secrets/moss-node-password, then moss-node join "INVITE_LINK" with an invite from the Sensorica group in Moss. The Moss page in Grafana is titled “Is the Sensorica group always online?”.
Holochain line and hApps
The fleet runs Holochain 0.6.3 (ADR-015) and the three workshop hApps below, all from nixos-holochain.nixosModules.sensorica-event-node (#33): the module repository’s own event profile, layered onto holochain-edgenode by every host in flake.nix’s fleetModules. It is the same export any other host rehearsing the workshop imports, so this fleet and that host cannot drift apart on the package, the hApp set or the seed; checks.eventProfileParity in flake.nix fails evaluation if sensorica-holoport-01 ever overrides one of these away from the module’s defaults.
The line is not a preference: each of the three hApps below has a 0.6 release and none has a 0.7 one. The maintainers re-evaluate this seven days before the workshop date.
Every node installs all three at boot, on one network seed (sensorica-workshop-2026), which is what makes the five machines one DHT per app rather than five isolated ones:
| hApp | Version | Bundle |
|---|---|---|
| hREA | happ-0.4.0-beta | hrea.happ |
| Kando | v0.17.5 | kando.happ |
| Requests & Offers | v0.5.2 | requests_and_offers.webhapp, unpacked at build time |
Requests & Offers publishes a .webhapp and nothing else, and a conductor installs a .happ, so modules/sensorica-happs.nix (in the module repository) unpacks it in a derivation with hc web-app unpack from the same line. Nothing binary is committed: every bundle is pkgs.fetchurl by sha256 (ADR-012).
Three apps compile their wasm one after another on first boot, which on a Holoport is slow, so installerTimeout is 900 s (also from the profile). The installer polls for the result rather than trusting any single admin call, so that is a bound on each of its waits (per hApp, the install and then the enable settling), not on one call; the unit has no start timeout of its own.
Consuming the event profile from another host
Any other flake that rehearses the same workshop node (as Soushi’s homelab does) builds from the same export instead of repeating it:
# inputs: holonix-0_6.follows = "nixos-holochain/holonix-0_6";
modules = [nixos-holochain.nixosModules.holochain-edgenode nixos-holochain.nixosModules.sensorica-event-node];
That is the whole profile: package, the three hApps, the network seed, the installer timeout and the two metrics options. A host can still override any single value (a different seed, a longer timeout) with an ordinary assignment, because the profile sets each one with mkDefault. Trimming the hApp set is different: happs is an attribute set of submodules, so a plain happs = { hrea = ...; }; is merged with the profile’s three apps rather than replacing them. Drop one app with happs.kando.installed = false;, or replace the whole set with happs = lib.mkForce { ... };. The comment at the top of modules/sensorica-event-node.nix explains both.
Evaluate
cd examples/sensorica-fleet
nix flake check --no-build
nix eval .#nixosConfigurations.sensorica-holoport-01.config.system.build.toplevel.drvPath
The nixos-holochain input points at main, as a downstream fleet writes it (see above). From a checkout of this repository, evaluate against the checkout instead so local module changes are what gets tested:
nix flake check --no-build --override-input nixos-holochain "$(git rev-parse --show-toplevel)"
Hardware configuration
Each host ships a placeholder hardware-configuration.nix so the fleet evaluates before any machine exists. It is not a bare stub: it carries the Holoport disk layout of ADR-017, so a machine partitioned that way boots on this file as written. The partitioning and grub-install sequence follows holochain/wind-tunnel-runner; scripts/holoport-install.sh runs it, and docs/deployment.md § “Installing on a Holoport (legacy BIOS)” is the runbook.
GPT with a 1 MiB bios_grub partition and a vfat ESP labelled boot, an ext4 root labelled nixos, swap labelled swap; GRUB installed twice, the UEFI half by NixOS (device = "nodev", efiSupport, efiInstallAsRemovable, ESP at /efi-boot) and the BIOS half by one grub-install --target=i386-pc in the runbook. A Holoport boots legacy BIOS only; the laptops the fleet is installed from are usually UEFI; this serves both.
Once a machine exists, generate its real hardware configuration on it and commit that over the placeholder. Nothing needs keeping: the GRUB block lives in hosts/common.nix, because nixos-generate-config --show-hardware-config writes filesystems and kernel modules, never a boot loader.
sudo nixos-generate-config --show-hardware-config > hosts/sensorica-holoport-01/hardware-configuration.nix
Operator SSH keys
Public keys are not secrets, and a flake only ever sees git-tracked files, so the operator keys are committed: paste your ssh-ed25519 ... line into the operatorKeys list at the top of hosts/common.nix before deploying; it goes on the sensorica account and on root, which Colmena connects as. A fleet deployed with that list empty has no way in over SSH. Private keys, tokens and passphrases never enter git.
Deploy
# one machine
sudo nixos-rebuild switch --flake .#sensorica-holoport-01

# the whole fleet over SSH, in parallel
nix develop            # brings colmena into PATH
colmena apply --impure --on @all
colmena apply --impure --on sensorica-holoport-01
colmena apply --impure --dry-run

# inspect the evaluated hive
colmena eval --impure -E '{nodes, ...}: nodes.sensorica-holoport-01.config.services.holochain-edgenode.enable'
--impure is required with Colmena 0.4.0 on Nix 2.25: Colmena wraps the flake as an input named hive, and pure mode refuses to lock it (“cannot update unlocked flake input ‘hive’ in pure mode”). Colmena resolves nixos-holochain from this directory’s flake.lock, so --override-input does not reach it; bump the lock (nix flake update nixos-holochain) to deploy modules newer than the locked revision.
Workshop ISO
nix build .#nixosConfigurations.workshop-iso.config.system.build.isoImage
sudo dd if=result/iso/*.iso of=/dev/sdX bs=4M status=progress
sync
Participant Handout — Holochain Edgenode Workshop
Sensorica Lab, 2026
What we are building today
By the end of this session you will have:
- A working Holochain edgenode running on a real machine, declared entirely in a single Nix file
- Deployed that node into a 5-machine fleet using a single command
- Watched live P2P traffic between all nodes on Grafana
- Rolled back a configuration change in under 10 seconds
The loop you will learn
Edit configuration.nix in Kate
        ↓
sudo nixos-rebuild switch --flake .#sensorica-holoport-0X
        ↓
systemctl status holochain-conductor
        ↓
# if something breaks:
sudo nixos-rebuild switch --rollback
That is the whole practice. Everything else is understanding what lives in configuration.nix.
Key files in the repo
nixos-holochain/
├── flake.nix                          # Root: the reusable modules
├── modules/holochain-edgenode.nix     # The module you are using
└── examples/sensorica-fleet/
    ├── flake.nix                      # The fleet: five machines and the ISO
    └── hosts/sensorica-holoport-0X/configuration.nix  # Your machine's config, edit this
Useful commands
| Command | What it does |
|---|---|
nixos-rebuild switch --flake .#sensorica-holoport-01 | Rebuild and switch to new config |
nixos-rebuild switch --rollback | Roll back to previous generation |
systemctl status holochain-conductor | Check conductor health |
journalctl -u holochain-conductor -f | Follow conductor logs |
nix repl --file '<nixpkgs>' | Explore available options interactively |
nixos-option services.holochain-edgenode | View module options |
After the workshop
The repo stays alive. You can keep your edgenode running, add your own hApps, or contribute a new module.
- GitHub: https://github.com/Sensorica/nixos-holochain
- Issues welcome for bugs, questions, and module ideas
Pre-flight Checklist
Send this to participants one week before the workshop.
What to bring
- A laptop with one of:
- (a) NixOS already installed, or
- (b) A NixOS live USB ready to boot, or
- (c) A spare machine you can wipe (we provide USB keys at the lab)
- Ethernet cable if you have one (workshop wifi is the enemy of P2P traffic)
- An SSH client you are comfortable with
Optional but useful
- A second monitor (Kate + Konsole + Firefox side by side is the ideal layout)
- A basic understanding of what a systemd unit is
No Nix experience required
You do not need to know Nix before the workshop. We will walk through the flake together before anyone touches a keyboard.
Facilitator pre-flight (day before)
- Flash 5 USB keys with the workshop ISO
- Test ISO boots on at least one Holoport / NUC
- Verify
colmena applyreaches all 5 nodes over the local network - Confirm the hApp installer enabled hREA, Kando and Requests & Offers on every node (
journalctl -u holochain-happ-installer | grep 'Enabled app'); the bundles are fetched by hash, nothing goes inhapps/ - Bring a dedicated router (tested) — do not rely on Sensorica lab wifi alone
- Print or share the participant handout
- Have Grafana dashboard URL ready on a shared screen
Facilitator Guide
Audience: People who can already use a terminal and have heard of Holochain. No Nix experience required. Duration: 4 hours. Outcome: Each participant deploys a working edgenode and watches the fleet exchange messages. Format: Pre-flight sent one week before + facilitated session.
The 4-hour arc
| Time | Segment | Goal |
|---|---|---|
| 0:00 to 0:30 | Conceptual intro | Declarative vs imperative. Why this matters for Holochain. Fractal sovereignty framing if the room is receptive. |
| 0:30 to 1:15 | Flake walkthrough | Open the repo in Kate. Walk through flake.nix, the module, a host config. Show option discovery via nix repl. |
| 1:15 to 2:15 | First deploy | Each participant boots, clones the repo, runs sudo nixos-rebuild switch --flake .#sensorica-holoport-0N from examples/sensorica-fleet (rebuild on an installed Holoport). Conductor visible via systemctl status. |
| 2:15 to 3:15 | Observe | Open Grafana’s room screen and watch the fleet’s traffic: the five conductors running hREA, Kando and Requests & Offers on one network seed. Wind Tunnel is not part of this: it feeds nothing to Grafana (see docs/architecture.md § What the Wind Tunnel runner is, and is not). |
| 3:15 to 3:45 | Modify, rollback, join Moss | Change a hApp property, redeploy, then sudo nixos-rebuild switch --rollback. This is where the “aha” usually lands. Then have participants open Moss on their laptop and join the group hosted by the fleet. |
| 3:45 to 4:00 | Q&A + next steps | How to extend the module. How to contribute back. Where the project goes from here. |
Why KDE Plasma 6 on participant machines
Workshop nodes ship with KDE Plasma 6 as the desktop. Reasoning:
- Familiar paradigm. Most participants recognize KDE (taskbar, file manager, settings GUI). Lower cognitive load means more attention available for Nix concepts.
- Dolphin is a discoverability tool. Participants can browse the flake repo visually, see the file structure, click into modules. Helps cement “the flake is just files.”
- Kate + Konsole + Firefox side by side. Kate gets Nix syntax highlighting via the
nilornixdLSP. Konsole runsnixos-rebuild. Firefox holdssearch.nixos.org/options. Productive layout for learning. - Plasma 6 on NixOS is mature. Solid as of 2026.
Facilitation notes
- Option A vs B trade-off. Option A (pre-baked module, participants are users) is what this workshop does. Option B (live module authoring) is more interesting but riskier and only works for groups already comfortable with Nix. For 5-machine fleets with mixed audiences, A wins.
- Deployment tool.
colmena apply --impure --on @allfor parallel deploys (--impure: see the fleet README). Plainnixos-rebuild switch --target-hostif colmena feels like too much. - Network reality. Test the workshop network in advance. The December 2025 HolOS workshop was bitten by this. Bring a dedicated router.
- Grafana moment. This is the high point of the workshop. Make sure the room screen shows the three hApps In step on every machine before flipping it to the big screen.
Common failure modes and fixes
| Symptom | Likely cause | Fix |
|---|---|---|
holochain-conductor.service fails immediately | Conductor or keystore error | Check journalctl -u holochain-conductor; the unit creates its lair passphrase itself on first boot, so no init step is missing |
holochain-happ-installer.service fails | An app did not install or enable within installerTimeout (900 s on the fleet); the first boot compiles three hApps | journalctl -u holochain-happ-installer, then systemctl restart holochain-happ-installer. Bundles are fetched by hash when the system is built, never read from happs/ |
| Participants can’t see each other’s nodes | Firewall closed | Ensure openFirewall = true and router is not blocking DHT traffic |
colmena apply can’t reach nodes | SSH keys not set up | Add the facilitator’s SSH key to operatorKeys in examples/sensorica-fleet/hosts/common.nix before building |
| Live USB drops to emergency mode, “Expecting device /dev/disk/by-label/nixos-graphical-…” | Stick made with Ventoy | Write the ISO with dd and check it with cmp; see docs/deployment.md § Rescuing an install |
Installer fails on cache.nixos.org … after 0 ms | Router DNS answers IPv6 only, no IPv6 route | Public DNS on the live session with nmcli, then retry; see docs/deployment.md § Rescuing an install |
| Installer offers only manual partitioning on retry | Previous failed run still mounted | Unmount /tmp/calamares-root-* and swapoff -a, relaunch |
| Installer failed and the reason is unclear | Calamares hides nixos-install output | SSH in from a laptop and read /root/.cache/calamares/session.log; see docs/deployment.md § Rescuing an install |
Lessons from December 2025 (HolOS workshop)
See docs/archive/ for the original workshop notes. Key takeaways:
- Lab wifi is not reliable for P2P DHT traffic. Dedicated router is mandatory.
- HolOS image installation was faster but didn’t give participants the authoring experience — they flashed a pre-built Buildroot image rather than configuring their own stack. Participants felt they were watching, not building.
- 4 hours was the right duration. Longer risks losing the room after the Grafana moment.
Architecture
Design philosophy
The Holochain ecosystem has two deployment stories today:
- Dev environments via Holonix — Nix-based, well documented, mature.
- Production edgenodes via HolOS — a Buildroot-based appliance image you flash and run, not configure.
nixos-holochain fills the gap: a flake-based repo with reusable NixOS modules so that operators can deploy production node fleets with a single nixos-rebuild, without flashing a pre-built appliance image.
The architectural bet is simple. HolOS gives you a minimal Buildroot image to flash. This project takes the opposite approach: declarative NixOS configuration you own, so the community can compose Holochain with the rest of their infrastructure rather than around it.
Design record
The decisions behind this layout are recorded one per file in adr/, from ADR-005 (the fleet becomes an example) to ADR-017 (the Holoport as a legacy-BIOS target), with their amendments. ADR-001 to ADR-004 belong to an earlier design document that is not in the repository. When this document cites an ADR by number, that is where its full text lives.
Module hierarchy
flake.nix
├── modules/
│   ├── holochain-edgenode.nix     ← core: conductor + lair + hApp installer + metrics
│   ├── families.jq                ← the one place a holochain_* family's HELP and TYPE are written
│   ├── conductor-metrics.jq       ← dump-network-stats → Prometheus text
│   ├── conductor-counters.jq      ← running byte and message totals across closed connections
│   ├── dht-metrics.jq             ← list-apps + dump-network-metrics → per-DHT Prometheus text
│   ├── holochain-grafana.nix      ← optional: Prometheus + Grafana for a fleet
│   ├── holochain-rules.nix        ← the recording rules every dashboard reads
│   ├── holochain-services.nix     ← the services each node runs, by name, for the dashboards
│   ├── dashboards/                ← provisioned Grafana dashboards
│   ├── holochain-windtunnel.nix   ← optional: donate the machine to the Foundation's Nomad cluster
│   ├── holochain-http-gateway.nix ← optional: HTTP gateway in front of the conductor
│   ├── holochain-bootstrap.nix    ← optional: Kitsune2 bootstrap and relay server
│   ├── holochain-moss-node.nix    ← optional: a Moss group's always-online node (not in default)
│   ├── moss-node-names.jq         ← the Moss node's names file for the exporter
│   ├── dashboards-moss/           ← the Moss node's Grafana page
│   ├── sensorica-event-node.nix   ← the Sensorica workshop profile (not in default)
│   ├── sensorica-happs.nix        ← the three workshop hApps, fetched by hash
│   └── default.nix                ← aggregator: edgenode, grafana, windtunnel, http-gateway, bootstrap
├── packages/
│   ├── holochain-http-gateway.nix ← the hc-http-gw build, one release per Holochain line
│   ├── holochain-conductor-exporter.nix ← the one program that writes holochain_* series, for any conductor
│   └── wdocker.nix                ← Moss wdocker, with the Holochain it pins
└── templates/
    ├── minimal/                   ← nix flake init -t …#minimal: one edgenode
    └── fleet/                     ← nix flake init -t …#fleet: five nodes, Grafana, ISO
Modules are independent. Import only what you need.
Units each module creates
| Unit | Type | Condition |
|---|---|---|
holochain-conductor.service | notify (simple when useSystemdNotify = false) | holochain-edgenode.enable |
holochain-happ-installer.service | oneshot, RemainAfterExit, runs every boot | happs != {} |
prometheus-node_exporter.service | simple | metricsExporter.enable, or holochain-grafana.enable |
holochain-conductor-metrics.service | oneshot, driven by the timer | conductorMetrics.enable |
holochain-conductor-metrics.timer | OnBootSec / OnUnitActiveSec = interval | conductorMetrics.enable |
grafana.service | simple | holochain-grafana.enable |
prometheus.service | simple | holochain-grafana.enable |
holochain-http-gateway.service | simple, DynamicUser, restarts until the conductor answers | holochain-http-gateway.enable |
podman-wind-tunnel-runner.service | simple, from virtualisation.oci-containers | holochain-windtunnel.enable |
holochain-bootstrap.service | simple, DynamicUser, no state directory | holochain-bootstrap.enable |
holochain-service-health.service | oneshot, driven by the timer: runs every declared health check and writes holochain-service-health.prom | a health check is declared (the bootstrap server declares one) and services.holochain-services.textfileDirectory is set |
holochain-service-health.timer | OnBootSec / OnUnitActiveSec = 30 s | as above |
moss-node.service | simple, its own moss-node user, the password as a credential | holochain-moss-node.enable (moss-node.md) |
moss-node-metrics.service, moss-node-metrics.timer | oneshot driven by a 30 s timer: the conductor exporter under the name Moss | holochain-moss-node.enable |
Service dependency graph
network-online.target
    └── holochain-conductor.service        (notify: active once the conductor is ready)
            ├── holochain-happ-installer.service (oneshot, runs every boot, idempotent)
            └── holochain-conductor-metrics.timer
                    └── holochain-conductor-metrics.service (oneshot, every 30s)
Deployment model
The root flake ships modules only. A fleet is its own flake that takes this repository as an input; examples/sensorica-fleet/ is the Sensorica Lab one, with a host per machine and a Colmena hive:
cd examples/sensorica-fleet
colmena apply --impure --on @all
Each node is a standard NixOS system. Colmena handles SSH-based parallel deployment. No custom daemon, no extra moving parts.
State separation
- Nix store (
/nix/store): immutable, shared, garbage collected. All binaries, configs, and scripts. - Data dir (
/var/lib/holochainby default): mutable, persistent. Conductor state, lair keystore, DHT data.
A nixos-rebuild switch never touches the data dir. Rollbacks are safe.
Two Holochain lines, one module
The module supports Holochain 0.6 and 0.7 from a single option set. Everything that differs is derived from one value, lib.versionOlder cfg.package.version "0.7", and both lines are exercised by real VM tests (vmTest / vmTestWithHapp on 0.7.0, vmTest-0_6 / vmTestWithHapp-0_6 on 0.6.3) rather than asserted. The root flake carries both toolchains: holonix pinned to main-0.7 and holonix-0_6 pinned to main-0.6, with the 0.6 binaries also exposed as packages.<system>.holochain-0_6 and hc-0_6.
Switching a node to the 0.6 line is two options:
services.holochain-edgenode = {
  enable = true;
  package = inputs.holonix-0_6.packages.${pkgs.system}.holochain;
  hcPackage = inputs.holonix-0_6.packages.${pkgs.system}.hc;
};
or, against this flake’s own outputs, nixos-holochain.packages.${system}.holochain-0_6 and hc-0_6. Everything else follows: the network section, the admin CLI prefix, and the HTTP gateway release.
Three things differ, and nothing else does.
1. The network section
Every key below was read from holochain --create-config on each line and from Holo-Host’s own 0.6.1 template, then confirmed by booting a conductor on the result.
0.6 (verified on 0.6.3) carries three keys:
network:
  bootstrap_url: https://dev-test-bootstrap2.holochain.org
  signal_url: wss://dev-test-bootstrap2.holochain.org
  relay_url: https://use1-1.relay.n0.iroh-canary.iroh.link./
0.7 (verified on 0.7.0) carries two:
network:
  bootstrap_url: https://dev-test-bootstrap2.holochain.org/
  relay_url: https://use1-1.relay.n0.iroh-canary.iroh.link./
network.signal_url was removed from the 0.7 schema; the module keeps signalUrl as an option so a 0.6 configuration still expresses it, ignores it from 0.7, and warns when it is set there. relay_url is not optional on either line: a 0.6.3 conductor handed a network section of only bootstrap_url and signal_url refuses to start.
The specified config file could not be parsed, because it is not valid YAML. Details:
    network: missing field `relay_url` at line 11 column 3
That is why the 0.6 section has three keys rather than the two an earlier draft of this design called for, and it matches Holo-Host/edgenode docker/conductor-config-0.6.1.template.yaml, which is where the 0.6 defaults come from. The 0.7 defaults are whatever holochain --create-config writes for itself. Neither pair is a production endpoint: dev-test-bootstrap2 and the iroh canary relay are development infrastructure, and no production bootstrap or relay is documented for either line at the time of writing. Point bootstrapUrl and relayUrl at your own for a real deployment.
2. The admin CLI
From 0.7, admin calls go through hc client call --port <p>. On 0.6 that subcommand does not exist: hc 0.6.3 offers only dna, app, web-app and sandbox, and asking for hc client call panics as an unresolvable external subcommand.
thread 'main' panicked at crates/hc/src/lib.rs:110:22:
Failed to run external subcommand: Os { code: 2, kind: NotFound, message: "No such file or directory" }
The 0.6 equivalent is hc sandbox call --running <p>. Below that prefix the two lines are identical: same subcommand names, same arguments, same JSON, so the installer only makes the prefix version-aware.
3. The HTTP gateway release
The gateway is a separate program with its own release train, and it links the conductor’s client libraries, so a build cannot straddle the two lines. Upstream publishes one gateway line per Holochain line, which modules/holochain-http-gateway.nix selects from the same cfg.package.version the network section is derived from. See “The HTTP gateway” below.
The rest of the conductor config
This is what the module writes on the 0.7 line, and what a 0.7.0 conductor accepts:
data_root_path: /var/lib/holochain
keystore:
  type: lair_server_in_proc
  lair_root: /var/lib/holochain/ks
admin_interfaces:
  - driver:
      type: websocket
      port: 4444
      allowed_origins: "*"
network:
  bootstrap_url: https://dev-test-bootstrap2.holochain.org/
  relay_url: https://use1-1.relay.n0.iroh-canary.iroh.link./
allowed_origins is the string *, not Any. --create-config prints a Rust Debug line containing allowed_origins: Any just above the file it writes, and that value serializes to '*' in the YAML. A conductor started on a config carrying allowed_origins: "*" reaches Conductor ready., so no --origin header is needed on the admin call. Pass --origin only if you narrow allowedOrigins to a specific list.
The full set of top-level keys the 0.7.0 schema accepts is admin_interfaces, data_root_path, db_max_readers, db_sync_level, incoming_request_concurrency_limit, keystore, network, restore_chain_quorum, tracing_override, tracing_scope, tuning_params and wasm_backend.
Four more options add keys only when set, so the default config above is unchanged by them:
| Option | Renders | Lines |
|---|---|---|
relayAllowPlainText | network.advanced: {"irohTransport":{"relayAllowPlainText":true}}, merged by the conductor under the keys it sets itself | both |
requestTimeoutS | network.request_timeout_s | both |
dbSyncLevel | top-level db_sync_level (Full, Normal, Off) | 0.7 only; warned and dropped below it |
wasmBackend | top-level wasm_backend (cranelift, LLVM, wasmi) | 0.7 only; warned and dropped below it |
The edgenodeConfigRender check renders all four on each line and starts that line’s conductor on the result. The holonix 0.7.0 binary is built with cranelift only: given wasm_backend: LLVM it exits with “Conductor is configured to use the LLVM WASM backend but this binary does not support it”, which is also how that check was shown able to fail.
dataDir has a length limit
The lair keystore listens on a unix socket at ${dataDir}/ks/socket, and unix socket paths are capped at SUN_LEN, 108 bytes. A deep dataDir makes the conductor exit during startup with a message that never mentions the config:
ERROR holochain::conductor::conductor::builder: Failed to spawn Lair keystore in process
  err={"error":"InvalidInput","message":"path must be shorter than SUN_LEN"}
The default /var/lib/holochain yields a 28-byte socket path and is safe. If you relocate the data directory, keep it short.
The lair passphrase and readiness
lair_server_in_proc wants a passphrase, and a NixOS service has nobody to type one. This part of the design follows Holo-Host/holo-host nix/modules/nixos/holochain/default.nix, which solved the same problem for the 0.5 line.
The conductor unit’s preStart generates ${dataDir}/lair-passphrase (mode 0600, 32 random bytes base64-encoded, no trailing newline) the first time it runs and reuses it forever after. holochain --piped then reads it from stdin. The file lives in the unit’s StateDirectory (mode 0700) rather than in the Nix store, so it is neither world-readable nor lost on a rebuild, and the keystore opens again after a reboot with nobody present. vmTestWithHapp proves this by cold-booting the VM and re-checking the installed app.
The unit runs as Type = "notify": the conductor signals systemd when it is ready, so holochain-conductor.service becomes active when the admin interface is actually usable rather than when the process exists. TimeoutStartSec is raised to 600s because an unaccelerated VM needs around 80 seconds to get there. Set useSystemdNotify = false to fall back to Type = "simple".
The hApp installer
These are the exact commands the installer runs, with the flags taken from <hc> client call <cmd> --help (0.7.0) and <hc> sandbox call <cmd> --help (0.6.3) of the pinned binaries:
hc client call --port <adminPort> install-app --app-id <id> <path-to.happ> [network-seed]
hc client call --port <adminPort> enable-app <id>
hc client call --port <adminPort> add-app-ws <appPort> --allowed-origins '*'
hc client call --port <adminPort> list-apps
hc client call --port <adminPort> list-app-ws
On the 0.6 line, substitute hc sandbox call --running <adminPort> for hc client call --port <adminPort>; the rest is unchanged.
install-app takes the bundle path and the network seed as positional arguments, in that order; --app-id and --agent-key are the only options. add-app-ws takes the port positionally.
The unit is a oneshot that runs on every boot, so each call has to tolerate already having been made. The three calls behave differently, which is why the script is not a straight list of commands:
| Call | Repeated on an already-installed node | Installer’s response |
|---|---|---|
install-app | fails, AppAlreadyInstalled("<id>"), exit 1 | guarded by list-apps |
enable-app | succeeds, exit 0 | run unconditionally, which is what keeps the app enabled |
add-app-ws | fails, AddrInUse, exit 1 | guarded by list-app-ws |
Both guards read JSON, and both lines emit the same shapes. list-apps returns an array of app records whose identity key is "installed_app_id":"<id>" and whose state after enabling is "status":{"type":"enabled"}; the bare app id also appears inside the embedded manifest, so anything counting installations has to match the key, not the id. list-app-ws returns [{"port":8888,"allowed_origins":"*","installed_app_id":null}].
A failed call is not a failed install
Installing or enabling a hApp makes the conductor compile the app’s wasm. On a small machine that takes longer than the admin client’s own request deadline, and the call comes back as an error while the conductor carries on and finishes the work:
holochain-happ-installer[1282]: Error: Websocket error: Timeout
holochain-happ-installer[1282]: Caused by:
holochain-happ-installer[1282]:     0: Timeout
holochain-happ-installer[1282]:     1: deadline has elapsed
So the installer does not treat a call’s exit status as the answer. It runs install-app and enable-app tolerantly and then polls list-apps for the outcome it wanted, failing the unit only if the app never appears or never reaches enabled within installerTimeout. This is what makes the service survive a first boot on modest hardware; it is also why the VM tests give their node four cores rather than the test driver’s default of one.
Observability
The workshop’s high point is a dashboard showing the fleet’s Holochain traffic. Three pieces make it, and only the first is Holochain-specific.
1. Conductor metrics
There is no Prometheus endpoint on a Holochain conductor. There is an admin call, dump-network-stats, that answers with the Kitsune2 transport’s own numbers, and node_exporter has a textfile collector that serves any *.prom file in a directory. So the module bridges the two with a timer rather than with a daemon: a long-lived exporter holding an admin websocket open would be one more thing to supervise, restart and version, for exactly the same series.
holochain-conductor-metrics.timer fires every conductorMetrics.interval (default 30s). Its oneshot service runs
hc client call --port 4444 dump-network-stats        # 0.7
hc sandbox call --running 4444 dump-network-stats     # 0.6
also calls list-apps for the installed apps, folds the reply’s per-connection counts into running totals with modules/conductor-counters.jq, pipes the lot through modules/conductor-metrics.jq, and moves the result into metricsExporter.textfileDirectory atomically, because the collector may read the directory at any moment.
The service is a thin wrapper around one program, packages.<system>.holochain-conductor-exporter (packages/holochain-conductor-exporter.nix), which any other conductor on the machine runs too: a Moss node, say, under its own name. It takes the conductor’s name, a command that prints the admin port and optionally the allowed origin (a Moss node picks both anew at every start), the names file described below, the textfile to write and a directory for the running totals. Every line it writes carries conductor, from conductorMetrics.name (default Holochain), so two conductors on one machine never merge into one series.
One program matters for a reason that is easy to miss. node_exporter’s textfile collector merges every *.prom file of its directory by family, and when two files give one family different # HELP text it logs inconsistent metric help text, keeps the family from the first file only, and sets node_textfile_scrape_error to 1: every series of that family in the second file vanishes. So every # HELP and # TYPE line lives in one place, modules/families.jq, which both jq programs include, and a family missing from it is an error rather than a line made up on the spot. checks.metricsHelpAgreement runs the whole program for an edgenode-shaped conductor and a Moss-shaped one on captured replies, requires every family the two files share to be declared with the same bytes, and then has a real node_exporter read both files and serve every sample line of both, one for one, with node_textfile_scrape_error 0. The count matters because node_exporter has a second way to lose a series that leaves the scrape error at 0: a series another file already gave with the same name and labels is dropped with only an ERROR ... was collected before with the same name and label values in its log. A family that loses its conductor label does that, and so do two conductors on one machine left under the same name, which is why each needs its own conductorMetrics.name.
The reply is Kitsune2’s TransportStats (kitsune2 crates/api/src/transport.rs), wrapped by Holochain with blocked_message_counts. It is byte-identical on both lines. Verified against the pinned binaries, on a bare conductor with no app installed and no peers:
$ hc client call --port 4471 dump-network-stats            # holochain 0.7.0
{"transport_stats":{"backend":"iroh","peer_urls":["https://use1-1.relay.n0.iroh-canary.iroh.link.:443/57b3f7ba59f9e69714ce3033240108fbffba2f31d1d584df540eb4f8a788a164"],"connections":[]},"blocked_message_counts":{}}

$ hc sandbox call --running 4461 dump-network-stats        # holochain 0.6.3
{"transport_stats":{"backend":"iroh","peer_urls":["https://use1-1.relay.n0.iroh-canary.iroh.link.:443/eee66b1f1962c1132a11638571f477e9c90575f4378c636c81096502db1c9d9c"],"connections":[]},"blocked_message_counts":{}}
dump-network-metrics, the other candidate the issue named, answers {} on a conductor with no app installed, because it reports per-DNA gossip state and there is none. dump-network-stats always has something to say, which is why the gauges are derived from it.
Each entry of connections carries pub_key, send_message_count, send_bytes, recv_message_count, recv_bytes, opened_at_s and is_direct. These are the series derived from them, each labelled conductor:
| Series | Type | Meaning |
|---|---|---|
holochain_conductor_up | gauge | 1 when the admin interface answered, 0 when it did not |
holochain_conductor_peer_connections | gauge | Transport connections currently held |
holochain_conductor_direct_peer_connections | gauge | Of those, the ones that upgraded off the relay |
holochain_conductor_peer_urls | gauge | Peer URLs this conductor can be reached at |
holochain_conductor_network_sent_bytes_total | counter | Bytes sent, kept as a running total across connections that have closed |
holochain_conductor_network_received_bytes_total | counter | Bytes received, kept as a running total across connections that have closed |
holochain_conductor_network_sent_messages_total | counter | Messages sent, kept as a running total across connections that have closed |
holochain_conductor_network_received_messages_total | counter | Messages received, kept as a running total across connections that have closed |
holochain_conductor_blocked_messages_total | counter | Messages blocked in either direction, summed over every block reason |
holochain_conductor_apps{conductor, status} | gauge | Installed apps by status type from list-apps; enabled and disabled always present, absent when list-apps did not answer |
holochain_conductor_metrics_scrape_timestamp_seconds | gauge | When the textfile was last written |
Two properties are worth stating explicitly:
- A down conductor reports
holochain_conductor_up 0, it does not disappear. The script writes the file whether or not the call succeeded, so a dead node is visible on the dashboard rather than absent from it. This is the difference between a panel that says “one node is down” and a panel that quietly draws four lines instead of five. - The byte and message counters only go up. The reply counts per open connection, so its plain sum drops whenever a peer disconnects, and
rate()reads any drop as a counter reset: it would draw the whole remaining total as a burst of traffic that never happened. So the timer keeps the counts it last saw per connection, keyed bypub_keyandopened_at_s, and the running totals, inconductor-metrics-counters.jsonunder the conductor’sdataDir, and adds each connection’s growth since the previous run (modules/conductor-counters.jq). What a connection moves between the timer’s last look and its closing is not counted, so the totals undercount by at most one interval of a closing connection. A run the conductor does not answer leaves the state as it was, so a connection that outlives a timeout is not counted a second time from zero. Losing the state file restarts them from zero, which Prometheus handles as the reset it is.
Per-DHT series
dump-network-stats is transport-wide: it cannot say which app network a peer or a byte belongs to. Once an app is installed, dump-network-metrics --include-dht-summary can, so the same timer also runs
hc client call --port 4444 dump-network-metrics --include-dht-summary        # 0.7
hc sandbox call --running 4444 dump-network-metrics --include-dht-summary     # 0.6
and passes its reply, with the list-apps reply, to modules/dht-metrics.jq. The reply is keyed by DNA hash; each entry has a fetch_state_summary (pending_requests, one entry per operation asked of a peer and not yet received) and a gossip_state_summary whose peer_meta holds, per peer URL, last_gossip_timestamp in microseconds, completed_rounds, peer_timeouts and the peer’s own dht_op_count, next to local_op_count for this node. Kitsune2 declares these structs identically in kitsune2_api 0.4.1 and 0.5.0, and the fixtures under tests/fixtures/dht-0_6_1/ are both replies as a Holochain 0.6.1 conductor in seven DHTs gave them (a Moss group node, network seeds redacted). The homelab’s Holochain 0.6.3 edgenode conductor, with three apps in four DHTs, gave the second pair of fixtures, under tests/fixtures/edgenode-0_6_3/. list-apps names the app and role each DNA belongs to, so every series carries conductor, app_id (the installed_app_id), role and dna, and nothing else: machine keys only.
| Series | Type | Meaning |
|---|---|---|
holochain_dht_peers | gauge | Peers this conductor keeps gossip state for in the DHT (entries in peer_meta) |
holochain_dht_local_ops | gauge | DHT operations held here (local_op_count) |
holochain_dht_peer_ops | gauge | The largest dht_op_count any peer reported; local_ops reaching it means this node holds as much as its best peer |
holochain_dht_pending_fetches | gauge | Operations asked of peers and not yet received |
holochain_dht_seconds_since_gossip | gauge | Seconds since the latest last_gossip_timestamp over all peers; -1 when there is none |
holochain_dht_completed_rounds_total | counter | completed_rounds summed over the peers currently in peer_meta |
holochain_dht_peer_timeouts_total | counter | peer_timeouts summed over the same peers |
The two counters are sums over the peers the conductor still knows, so forgetting a peer lowers them, which rate() reads as a reset; they are exported as the conductor keeps them rather than folded into running totals the way the byte counters are.
Names
No hash, loopback port or role id is meant to reach a screen, and a rename must never split a data series. So names travel apart from the data, on two info families whose value is always 1, written by the same program and joined at query time:
| Series | Labels |
|---|---|
holochain_app_info | conductor, app_id, app_name, app_kind, status (the list-apps status, or expected) |
holochain_dht_info | conductor, app_id, role, dna, app_name, app_kind, part_name, network_label |
Everything that knows a name puts it in a JSON file the program reads as the third document on the jq’s stdin, so this program stays the only writer of both families:
{
  "apps": {
    "requests-and-offers": { "name": "Requests & Offers", "roles": { "requests_and_offers": "Listings", "hrea": "Accounting" } },
    "applet#uhc$e$k...": { "name": "General chat", "kind": "Vines" }
  },
  "kinds": { "Vines": { "rVines": "Messages", "rFiles": "Files" } },
  "expected": ["hrea", "kando", "requests-and-offers"]
}
holochain_dht_info has exactly one row per conductor, app_id, role and dna, the full key of every holochain_dht_* series, so a query that joins names onto data must match on all four (and instance): * on (instance, conductor, app_id, role, dna) group_left (network_label) holochain_dht_info. A join on fewer is a many-to-many error as soon as an app has a clone cell, because a clone shares its conductor, app id and role with the cell it was cloned from and differs only in its DNA; Prometheus then fails the whole query, not only the clone’s line.
The edgenode module writes the file from each app’s displayName and roleNames, and lists in expected every app it manages with installed = true. An app’s kind is read only when the app is expected and list-apps does not report it, since its bundle, where the kind otherwise comes from, is then unknown; a Moss wrapper that lists the tools it has seen as expected passes each one’s kind with it. What a name falls back to when nobody gave one:
app_name: the bundle’s name fromlist-apps, underscores and dashes read as spaces and the first letter capitalised (requests_and_offersreads “Requests and offers”). A Moss tool (applet#...) takes its kind instead, and a Moss group (group#...) reads “Group”. An expected app nobody listed takes its id prettified, except a Moss app, which takes itskindfrom the names file, else “Group” or “Tool”, never its id, which is a hash. Two apps that would read alike, the two chats of one Moss tool for instance, are numbered in the order of their installed_app_id (“Vines 1”, “Vines 2”). A given name can still match another app’s name; the two are then numbered too, the given name keeping its own (“Kando” and “Kando 2”). No two apps of one conductor share a name, and a hash is never how two of them are told apart.app_kind: for a Moss app, the bundle’s name without the “h” before a capital (hVinesreads “Vines”), or “Group”, or for a Moss app nobody listed, the names file’skind, else “Group” or “Tool”; for any other app, itsapp_nameagain.part_name: the app’s ownrolesentry, then thekindstable for the app’s kind, then nothing when the app has a single role (its network then reads by the app’s name alone, “Kando” rather than “Kando: Kando”), and otherwise the role id with a one-letter prefix dropped (rFilesreads “Files”), or “Main” when that would only repeat the app’s name or kind (“Group: Main” rather than “Group: Group”). A clone cell adds its clone index, counted from 1 (“Messages (clone 1)”, or “Clone 1” for a one-role app), from itsclone_id, else from its place among the role’s clones.network_label:app_namealone for a one-part app, else “app_name: part_name”. No two DHTs of one conductor share one.
An app in expected that list-apps does not list, or every expected app when list-apps did not answer, is still written to holochain_app_info, with status="expected", so a dashboard can show it as not running instead of losing it. A names file that is missing or of the wrong shape costs the names, never the series. checks.metricsNameShape fails when any app_name, app_kind, part_name or network_label the program writes for the two fixture conductors, the Moss one also stopped with its apps only expected, contains $ (Moss’s case escape) or uhC (a hash) anywhere, or a run of twenty or more id characters without a space anywhere in it.
What happens when something goes wrong is chosen so that it costs only these series. Either call failing writes no holochain_dht_* line at all, rather than zeros that would read as a DHT with no peers; a cell whose DNA the reply does not list is skipped for the same reason. Label values are escaped, since an app id is free text and one unescaped quote would make node_exporter drop the whole file. And the script appends the jq output only when jq exits cleanly, so a reply of an unexpected shape loses the DHT series for that run and never the conductor series. Both replies reach jq on stdin rather than as --argjson: a list-apps reply carries every DNA’s properties, the Moss node above answers 110 KB for three apps, and Linux caps a single command-line argument at 128 KiB.
checks.dhtMetricsJq runs the jq on both pairs of captured replies and checks the numbers of one DHT by hand, the names with no names file, with a Moss-shaped one and with a hand-typed one in the shape the edgenode module writes, that every data series has exactly one info row with its key, that no two apps or DHTs of one conductor share a name, and that names never change a data line; then a stopped Moss conductor whose apps are only expected, given names that match other apps’ names, each call failing, an empty network, list-apps not answering while apps are expected, names files of the wrong shape, and an app id and a conductor name with a quote, a backslash and a newline in them next to stem, cloned and unlisted cells and fields of the wrong type, passing every output through promtool check metrics. checks.edgenodeNamesWiring covers what that hand-typed file cannot: it evaluates a system with the edgenode module, displayName, roleNames, an app with installed = false and a conductorMetrics.name with a space in it, runs the metrics unit’s own script with the exporter swapped for one that prints its arguments, and feeds the names file it points at through the jq with the captured edgenode replies. vmTestWithHapp and vmTestWithHapp-0_6 install a real hApp and assert that every cell list-apps reports has its seven series on /metrics and one holochain_dht_info row, with 0 peers and -1 seconds since gossip on a node that is alone on its network.
2. Prometheus and Grafana
holochain-grafana runs both on the monitor node and provisions the pair that makes a dashboard work without a human: a Prometheus data source with the fixed uid holochain-prometheus, and every JSON file under modules/dashboards/.
Five dashboards, one question each
The shipped dashboards are built around who reads them and what that reader asks, and each is titled with the question. All five are tagged holochain and link to one another.
| uid | Title | Reader |
|---|---|---|
holochain-home | What is this machine running? | Anyone opening Grafana: it is Grafana’s home page, and opens on the machine Grafana runs on |
holochain-now | Is the Holochain network working? | The room, on a shared screen in kiosk mode |
holochain-fleet | Which Holochain node needs attention? | Whoever runs the fleet |
holochain-node | Is this node working, app by app? | An operator with one machine, or a link from the fleet page |
holochain-network | Is this app in step on every node? | The facilitator asked whether a message reached the others, or the operator after a Lost contact |
The home page says what one machine runs, in words: its state, host name, NixOS release, kernel, how long it has been up and how busy its processor, memory and fullest disk are; then every service it runs, worst first, with its state, the version of what it runs and when it last started; then its Holochain conductors, each with the service that runs it, its Holochain version and whether it answers, and every app on them in the six state words. A node picker shows any machine of the fleet, and links lead to the fleet, node, network and room pages and, where the Moss module provisions one, to the Moss page. The node page and the Moss page open on the machine the home page shows; the network page opens on every node, since its question is about the whole fleet. The room screen answers in plain words: whether its readings are current, one tile per machine, a matrix of app by machine in the six state words, how many others each app sees, a step chart of the data each machine holds in the room’s app (a write steps every line up together), and how long since each app last heard from anyone. The fleet page counts what is wrong across the fleet, lists the machines worst first, names every problem in a sentence, lists the watched services that are down, and keeps machine health in a collapsed row. The node page takes one machine part by part, lists every service it runs by name with its state, and keeps its machine health and network traffic in collapsed rows. The network page takes one app network, chosen by its name, across every machine.
The pages never name a series by a machine key. Legends, display names and table columns use only labels a person reads (node, site, conductor, app_name, app_kind, part_name, network_label, a problem sentence, a unit and its state mapped to words, a disk’s mount point, a sensor, the machine’s host name, system and kernel release, and the version and holochain_version a service declares), every table keeps an explicit list of its columns, no stat picks a key as its field, no title, description or legend shows a variable whose value is a key (the network page names its network in the dropdown, by its label, never by the DNA hash the variable holds), and every panel carries a description of the question it answers. A link by address never carries a page’s node to a page whose node picker opens on every node, such as the network page, so a question about the whole fleet never comes up for one machine. The one exception is the collapsed “For bug reports” row of the network page, which shows the node, conductor, installed app id, role and DNA hash of one network, to paste into an issue. No variable carries an app id: Moss ids contain $, which Grafana would read as a variable, so the network page keys on the DNA and shows its name. checks.dashboardLabels holds the JSON to all of this.
The service tables read the rule holochain:service_state, described under Services, from what each node runs, which rests on node_systemd_unit_state: node_exporter’s systemd collector exports it for every unit on the node except device, scope and slice units, and both modules pass --collector.systemd.unit-exclude so that mount units, which node_exporter leaves out by default, are counted when they fail. The module rewrites a few things into each provisioned dashboard on its way into the store, because the JSON is read-only once there and a browser edit would not survive a rebuild; everything else reaches Grafana untouched. For a dashboard of your own, a units textbox variable takes the overviewUnits keys as its default, and a field override on name takes their names as value mappings (the shipped pages have neither: they read the rules). The room constants are described below, and the state thresholds here. A threshold step whose fromOption key names a states option (the readings age, the silence before Lost contact, the in-step share) takes that option’s value, the plain steps beside it are clamped so the steps stay in order, and the sentences that quote a threshold (“more than 90 seconds old”, “at least 95%”, “in the last 24 hours”) quote the value given, so a page never colours a part amber while its word says In step. For a dashboards directory in the store, the module also sets Grafana’s default_home_dashboard_path to a copy of the rewritten holochain-home.json, whose node variable the rewrite defaults to this machine (the name of a scrape target on a loopback address, or at this machine’s host name or FQDN whatever key names it, else networking.hostName), so / opens on the machine Grafana runs on; a directory without it falls back to holochain-now.json, with its room constants, and one with neither to a copy of Grafana’s own home page, since Grafana answers a home path that does not exist with an error. The copy is chosen while building, never by looking into the directory while evaluating, so a directory inside a package does not have to be built first and the module evaluates where import-from-derivation is off.
Node names
Every node goes by a name, which Prometheus attaches to every series it scrapes from the node as the node label, next to instance; a site label joins it when one is given. The name comes from scrapeTargets, rendered as one static config per target. As an attribute set, the key is the name and the value gives the address and, optionally, the site:
scrapeTargets = {
  homelab = { address = "127.0.0.1:9100"; site = "Soushi home"; };
  lab-1 = { address = "sensorica-holoport-01:9100"; site = "Sensorica lab"; };
};
As a plain list of host:port strings, which is what the option took before, each node is named after the host part of its address, and a loopback address (127.0.0.1, localhost, ::1) takes the monitor’s networking.hostName. A list entry given by an IP address therefore goes by that address on every dashboard, and evaluation warns about each such entry, pointing at the attribute set form. Because the name comes from the target, a node that is down still has one. Two targets that would go by one name are refused at evaluation, since every dashboard aggregates by node and would read them as one machine; two ports on one loopback need the attribute set form. No exporter writes a node label of its own: with honor_labels off, Prometheus would keep the target’s and rename the exporter’s to exported_node.
States, computed once
The dashboards never compute a state themselves. modules/holochain-rules.nix holds one group of Prometheus recording rules, which the module renders with its states options and hands to Prometheus as a rule file, evaluated at every scrapeInterval; promtool check rules runs on the file when the system is built. Every state is a code ordered from worst to best, so min over any set picks the worst item:
| Code | DHT or app | Meaning |
|---|---|---|
| 0 | Not running | The app should be installed here and Holochain does not report it |
| 1 | No fresh readings | The conductor’s readings are older than states.staleAfterSeconds (90) |
| 2 | Lost contact | Nobody is connected, although somebody was within states.historyWindow (24h) or another node of the fleet runs the same DNA; or peers are known and nothing was heard from them for states.silentAfterSeconds (600) |
| 3 | No one else yet | Nobody is connected, nobody was, and no other node of the fleet runs the DNA: normal for a node that is alone |
| 4 | Catching up | Connected, holding less than states.inStepShare (0.95) of the best peer’s data on average over states.shareWindow (10m) |
| 5 | In step | Connected, and holding at least that share |
A conductor is 1 Holochain not answering, 2 No fresh readings or 3 Running. A service (below) is 0 Failed, 1 Stopped, 2 Not answering, 3 No fresh readings, 4 Starting, 5 Stopping or 6 Running. A node is 0 Unreachable, 1 Holochain not answering, 2 A service is down (failed, stopped or not answering), 3 No fresh readings (a conductor’s readings or a service’s health reading), 4 Running or 5 No Holochain here: unreachable wins, then the worst of its conductors and services, and a machine with neither a conductor nor a service down reads No Holochain here. A service that is down ranks above a reading that is old, because systemd’s word on the service is fresh, so a stale reading cannot hide a failed gateway, and the colours only get better from one code to the next (red, red, red, orange, green, grey). Starting and Stopping leave the node as it is, since a restart passes through them; a service that keeps failing while systemd restarts it reads Failed, not Starting (see below). A healthy DHT never holds everything its best peer holds, since new data is always on its way: the Sensorica Moss node’s DHTs held between 94% and 99% on 2026-09-27. Hence a share of 0.95 averaged over ten minutes rather than an instantaneous 1, and both are options to recalibrate on a real fleet.
The history behind Lost contact is kept per full DHT key, so it starts afresh whenever the labels of a DHT’s series change, as they do when a node switches from an exporter that wrote other labels to this one. For up to states.historyWindow after such a switch, a DHT that lost its peers before it reads No one else yet rather than Lost contact, unless another node of the fleet runs its DNA. Switching while the DHTs have peers avoids the gap.
| Series | What it is |
|---|---|
holochain:dht_state, holochain:app_state:named, holochain:conductor_state, holochain:node_state | The states above, per DHT, per app (its worst DHT), per conductor and per node |
holochain:dht_names | holochain_dht_info, or for a DHT without an info row a fallback named “Unnamed app”, its part named after its role id the way the exporter prettifies one (“rFiles” reads “Files”, “requests_and_offers” reads “Requests and offers”), so it is still drawn and counted |
holochain:dht_state:named, holochain:dht_peers:named, holochain:dht_share:named, holochain:dht_heard:named, holochain:dht_missing:named | Per-DHT series with the names joined on, for display; “heard” turns the -1 of never into 1e9, the longest silence there is |
holochain:dht_share, holochain:dht_share_raw | The share of the best peer’s data held here, only while there is a peer |
holochain:dna_nodes, holochain:dna_same_data, holochain:dht_had_peers, holochain:conductor_fresh | The inputs of the ladder, kept for panels that need them |
holochain:service_watched, holochain:service_state | The services watched on each node, one series per unit with its name in service, and the state of each; a conductor no watched unit claims is a service of its own, “Holochain conductor (<conductor>)” |
holochain:node_problem | One series per thing a human must act on, its sentence in the problem label: each failed unit, watched or not, by its watched name or else its unit name (“Holochain conductor has failed”), and likewise each unit that keeps failing while systemd restarts it (“Local bootstrap and relay failed and systemd is restarting it”), a watched service that is stopped, does not answer or has an old health reading (“Local bootstrap and relay is not answering”, “Local bootstrap and relay readings are over 90 s old”; a service that runs a conductor is left to the conductor’s own sentences), a disk or memory over 90%, a sensor over 85 °C, a metrics file node_exporter could not read, a conductor not answering or with old readings (named in brackets, except the default “Holochain”, which reads “Holochain is not answering”), app parts with no name |
Every join of names onto data matches on the full key of a DHT (instance, conductor, app_id, role, dna), for the reason given under Names: a clone cell makes any shorter key many-to-many. Counts that colour a panel read the raw-keyed rules, so a DHT whose name is missing still counts. checks.holochainRules runs promtool test rules on the rendered file: a node alone, three nodes in step and catching up, contact lost after having peers, on a DNA another node runs, and to silence, readings that stop, the homelab’s two conductors on one instance as the exporter writes them for the captured replies (tests/fixture-textfiles.nix, at the capture’s own clock so the gossip ages are the captured ones), an app Nix expects and Holochain does not list, DHTs with no name, node states, conductors under the default name, a machine in trouble, a healthy machine just under every threshold with a full tmpfs, which must raise no problem, and every service state in words with what each does to its node (a conductor unit active while its conductor does not answer, a Moss conductor no unit claims, a claimed conductor not listed twice, the readings of a claimed and of an unclaimed conductor gone old, a conductor under the default name, a stale health reading, a stopped service beside old readings), and, scraped every 15 s, services that keep failing while systemd restarts them, caught between two tries or in the moment they are up, against one restarted once and back up and one starting that was never restarted. A second rule file, rendered with overviewUnits set, must watch those units on the nodes that run them, by their names or unit names, while a node’s own name for a unit wins. It then breaks every expectation of both on its own and requires promtool to fail on each.
Services, from what each node runs
No list of services is kept by hand. Every nixos-holochain module imports modules/holochain-services.nix and, when it is enabled, adds the units it creates to services.holochain-services.units, each with the name a person reads; on a machine where any of them is enabled, the services beside them that are enabled there join the list too. Each node publishes its own list through node_exporter’s textfile collector, as holochain-services.prom, a link into the store refreshed on every activation, with one holochain_service_info{name, service, version} line per unit (and conductor and holochain_version for a unit that runs a conductor), so a monitor learns what a Holoport runs, and in which version, from the Holoport and not from its own configuration. Prometheus attaches the node’s name as it does to any series. The rule holochain:service_watched takes that list, plus any unit the monitor’s overviewUnits adds, and holochain:service_state gives each its state:
| Service, as the pages name it | Unit | Listed when | Health reading |
|---|---|---|---|
Holochain conductor, or “Holochain conductor (Workshop)” under conductorMetrics.name = "Workshop" | holochain-conductor.service | holochain-edgenode.enable | its conductor’s readings: Not answering when the admin interface does not answer, No fresh readings when they are old (conductorMetrics) |
| App installer | holochain-happ-installer.service | happs != {} | none; a one-shot that remains active once done |
| Holochain readings (timer) | holochain-conductor-metrics.timer | conductorMetrics.enable | none; the service sits idle between runs, the timer stays active |
| HTTP gateway | holochain-http-gateway.service | holochain-http-gateway.enable | none |
| Local bootstrap and relay | holochain-bootstrap.service | holochain-bootstrap.enable | /health every 30 s, on its first listen address or the loopback for a wildcard |
| Wind Tunnel runner | podman-wind-tunnel-runner.service (or docker-) | holochain-windtunnel.enable | none |
| Metrics database | prometheus.service | holochain-grafana.enable | none |
| Dashboards | grafana.service | holochain-grafana.enable | none |
| Machine readings | prometheus-node-exporter.service | node_exporter enabled | none |
| Remote login | sshd.service, or sshd.socket with startWhenNeeded | services.openssh.enable | none |
| Private network (Tailscale) | tailscaled.service | services.tailscale.enable | none |
| Nix | nix-daemon.socket | nix.enable (the socket, since the daemon starts on demand) | none |
“Holochain conductor (<conductor>)”, for example “Holochain conductor (Moss)” | none | a conductor whose readings reach this node_exporter and that no listed unit claims | its readings, as for the conductor above |
A service reads, worst first, Failed, Stopped, Not answering (the unit is active but its health check fails, or the conductor it runs does not answer), No fresh readings (its last health reading, or its conductor’s readings, older than states.staleAfterSeconds), Starting, Stopping, or Running. Failed covers a unit that keeps failing while systemd restarts it: with Restart= and a RestartSec, as the bootstrap server has (on-failure, 5 s), systemd reports such a unit as activating between two tries and never as failed, so the rule reads node_exporter’s restart count (node_systemd_service_restart_total, which the edgenode and grafana modules turn on with --collector.systemd.enable-restarts-metrics): restarted in two scrapes within states.staleAfterSeconds, or in one and not up yet, is Failed. Each shows in three places. The node page’s “Is each service on this machine running?” lists every one of that machine, worst first. The fleet page’s “Which services are not running?” lists the ones that are not Running on every machine. The room screen’s tile for the machine reads “A service is down” while one is Failed, Stopped or Not answering, and “No fresh readings” while one’s reading is old; for each of those the fleet page’s problem list names the service in a sentence, and the room’s “Are these readings current?” and the fleet’s Stale readings and Oldest reading count health readings as well as conductors’. A unit a node lists but does not run has no row at all, since node_exporter has no state for it, so evaluation warns about a listed service, socket or timer the configuration does not define.
Each module gives the unit it lists the version of the package it runs it from, as version, and a unit that runs a conductor also the Holochain that conductor is, as holochainVersion: the conductor its edgenode package’s version for both, the app installer its hcPackage’s, the HTTP gateway and the bootstrap server their package’s, Prometheus, Grafana, node_exporter, sshd, Tailscale and the Nix daemon theirs, and a Moss node wdocker’s with the Holochain wdocker brings (passthru.holochainVersion of the wdocker package), which can differ from the edgenode’s. Nothing is asked of a running service, so the version shown is the one the machine was built with. The readings timers and the Wind Tunnel runner, whose container is pulled by digest, declare none, and a unit a configuration lists without one publishes no version label, which the home page shows as a dash. The labels ride through holochain:service_watched into holochain:service_state, so the home page reads a service’s state and version from one series. When a unit last started comes from node_exporter’s node_systemd_unit_start_time_seconds, which both modules turn on with --collector.systemd.enable-start-time-metrics (zero for a unit that is not active, and left blank on the page).
The health reading exists for the bootstrap server because the 0.4.1 server can stay active while it listens on nothing (see listenAddresses), so its unit’s state alone would say Running. A timer, holochain-service-health, runs every check declared in services.holochain-services.healthChecks and writes holochain_service_healthy (1 or 0) and the time it ran, as root with no capability but the one that lets it write into a textfile directory another user owns.
Nothing is written unless services.holochain-services.textfileDirectory names the directory node_exporter reads. The edgenode module sets it when its metricsExporter is on, and the grafana module on a monitor, whose node_exporter defaults now include the textfile collector. A machine that runs only the bootstrap server, with a node_exporter of its own, sets it by hand; until then its services are missing from the pages. A conductor another program runs needs no unit listed, once its readings carry a conductor label: athanor’s Moss node will show as “Holochain conductor (Moss)” after athanor runs it through holochain-conductor-exporter with conductor “Moss” (step A1 of the dashboards design). Its current exporter, moss-node-metrics.jq, writes holochain_moss_node_up and no conductor label, so until then the Moss node has no row among the services.
Service names and the room
overviewUnits, on the monitor, adds units to watch on every node that runs them, on top of the ones each node lists, each with the name a person reads for it; a plain list still works, its units shown by their unit names, and a node’s own name for a unit it lists wins. Its default is empty. The rule file renders its keys into holochain:service_watched, anchored the way Prometheus anchors =~, so an entry such as restic-backups-.* names every unit it matches. For a dashboard of your own, every field override matched by name to name, the unit label of node_systemd_unit_state, gets one regex value mapping per named unit on its way into the store, and a units textbox variable gets the keys as its default. The room option (app, part, label) sets the constant variables room_app, room_part and room_label of any dashboard that declares them, for a room screen that follows one app’s writes; left null, those variables keep their dashboard’s own defaults. checks.grafanaProvisioning evaluates monitor systems and reads what the module renders: the labels of list and attribute set targets, the refusal of two targets sharing a name, a rule file with states other than the defaults, the shipped dashboards under other states (every marked step moved, no sentence quoting a default) and unchanged under the defaults, the rewrite of a fixture dashboard (tests/fixtures/dashboards/rewrite.json), the versions every module declares for its units, compared with the packages they run, and the published list, which must carry each as a version (and a conductor’s as a holochain_version) label, checked again on copies with one label removed, which must fail by the unit’s name; and the home page: the shipped “What is this machine running?” for the default directory, opening on the loopback target’s name, the key of a target at the host name or FQDN, or the host name, the room screen for a copy without it, Grafana’s own for a directory with neither, and a home path, with nothing built, for the directory of a package whose build always fails. A copy without the home page and a copy whose home page lost its uid must each fail the home page check.
vmTestGrafana runs the whole path in one VM, scraping its own node_exporter and a second target nothing listens on. Its edgenode installs one hApp, so the conductor is in DHTs; the test requires each of them named by its network_label and never by a key. It waits for the conductor, asserts holochain_conductor_up{conductor="Holochain"} 1 appears on /metrics, asserts the live target is up and the dead one down, and asserts Prometheus kept the series. It then asserts that Grafana’s search for the holochain tag returns exactly the five dashboards and that the same test fails on a search cut to four, that its home page is holochain-home, opening on machine, and that the same test fails on the room screen’s answer, and that the data source is there; reads the five back from Grafana’s API and checks that the room constants carry the room option, that the node page’s own label_values definition finds both nodes by name, and that the state words and colours (six for an app, six for a node, three for a conductor, seven for a service on all three service tables) reached the panels that show them. Before the conductor fails, the test names its two targets (machine, with a site, and unplugged) and requires every target to carry its node label; it then writes two more conductors, Workshop and Moss from tests/fixture-textfiles.nix, as textfiles beside the live conductor’s, and requires node_exporter to serve all of their DHT series with node_textfile_scrape_error at 0, Prometheus to report every rule of the file loaded, evaluated, healthy and without an error, holochain:node_state to read 2, A service is down, for machine, whose always-fails.service (added through overviewUnits) has failed, and 0 for unplugged, the services of machine to be exactly the ones its modules installed by their names, the two overviewUnits adds by their unit names, and the two fixture conductors no unit claims, the Moss one as “Holochain conductor (Moss)”, every service its modules list with a version to carry it as a label, the conductor’s own being its package’s for both version and holochain_version, the Moss DHTs to read In step for the connected chat and the group and No one else yet for the chat nobody else opened, the live app to read No one else yet, and the node’s problems to be exactly two sentences, one for each unit that always fails, the watched one and one no panel watches, each by its unit name. With the three conductors present, it posts every panel target of the five dashboards to Grafana’s /api/ds/query, the way Grafana’s own panels query, with the variables filled (All, the node, the connected Moss chat for the network page, the rewritten room constants), and requires each to come back without an error and with at least one frame holding a value. Exactly three may be empty and must still not error, and the log counts them apart from the answered ones: the two temperature panels, since a VM has no sensor (the hwmon collector is required to run instead), and “Same data everywhere”, which needs two nodes on one network. A query with an or vector() fallback answers whatever its left side reads, which is why checks.dashboardQueries also requires every series a query reads to be there. The same test on a query that cannot answer must fail. It also checks that every label a query matches negatively exists on its metric, since a misspelled one would match everything, and that mount units are exported. The fixtures are then removed and the conductor’s failures are exercised for real: its metrics timer stopped, then the conductor stopped with the timer writing again, then its textfile corrupted, with the node page’s Conductors query required to read No fresh readings and then Not answering, the fleet page’s problem list to name each in its sentence (“Holochain readings are over 90 s old”, “Holochain is not answering”, “A metrics file could not be read”), and the room screen’s readings tile to read No readings. Finally it fails on any provisioning error in Grafana’s journal.
A VM runs one conductor, so what two conductors on one instance do to the pages is checks.dashboardQueries, which needs no VM: promtool loads the rendered rule file and runs every Holochain query of the five dashboards, variables filled, on the exporter’s output for an edgenode-shaped and a Moss-shaped conductor on one instance, plus a third conductor with a clone cell, which shares its conductor, app id and role with the cell it came from. Every query must answer (“Same data everywhere” excepted, which needs two nodes). Answering is not enough for the twelve queries that end in or vector(0) or or vector(1e9), which answer whatever their left side reads, so every series selector a query reads, with its positive matchers (tests/query-selectors.jq), must also select something, and every rule a query names must be recorded by the rule file; “Same data everywhere” is held to the second only. The node page’s part table must have one row per DHT, the clone included, except Holds, only for the parts with a peer, and Last heard, which leaves out the parts nobody else runs yet; with the Moss conductor stopped, the fleet page’s node Status and the room screen’s machine tile must read Holochain not answering, the node’s worst conductor, and the node page’s services “Holochain conductor (Moss)” Not answering. The node lists three services in the fixtures, a conductor that claims Workshop, a stopped HTTP gateway and a bootstrap server with a fresh health reading: “Is each service on this machine running?” must name exactly those and the two conductors no unit claims (“Holochain conductor (Moss)”, “Holochain conductor (Clones)”), the fleet’s list of services down must hold the gateway alone, and the machine tile must read A service is down. The conductor and the gateway carry versions in the fixtures and the bootstrap server none: the home page’s services table must show each service with its version, a dash for the bootstrap server and the unclaimed conductors, and its conductors table one row per conductor, Workshop with the unit that runs it and its Holochain, Moss and Clones with dashes. It then breaks the queries one fault at a time and requires each to fail: a misspelt rule, in an ordinary query, behind a vector fallback, and in “Same data everywhere”; a misspelt metric and a label filter that selects nothing, both behind a vector fallback; the services table reading the watched list instead of the states; the home page’s services table losing its versions, and its conductors table joined so that a claimed conductor has two rows; and the part table joined on fewer labels than the full key, which must fail with a many-to-many error. checks.dashboardLabels runs its jq over the JSON, then over copies broken one fault at a time (a legend or display name showing a key, a display name showing every label at once through ${__field.labels}, a title showing a variable whose value is a key, a stat picking a key field, a query without a legend, a panel without a description, a table that keeps every label or shows a key column, the services tables of the node and home pages among them, a home page panel without a description, two dashboards on one uid, the home page among them), and requires each to fail for its reason. checks.dashboardWords reads each stand-in value the way Grafana resolves it through a field’s mappings, in order: 1e9 on the readings tile reads “No readings” in red, 1e9 on the three Last heard panels reads “never” in red, an empty Last heard or Holds cell on the node table reads “nobody else yet” or “nobody to compare” in grey, and a real figure stays a figure; copies with the range dropped, “never” recoloured, the empty-cell word dropped, or a range that swallows real figures must each fail.
vmTestServices runs one machine with an edgenode, the HTTP gateway, the local bootstrap and relay, and Grafana watching itself, and reads what a person reads through Grafana’s /api/ds/query, with the queries the pages serve. The node page’s “Is each service on this machine running?” must name exactly the services the enabled modules installed, by their names, each Running, and the room screen’s tile for the machine must read Running; the comparison is first run on answers one service short, one in another state and one too many, and must fail on each. The bootstrap server is then frozen with SIGSTOP: its row must turn to Not answering while systemctl is-active still says active, the fleet page must list it as down, the problem list must say “Local bootstrap and relay is not answering”, and the tile must read A service is down; each of those checks is first required to fail while the server answers. Thawed, it must read Running again; stopped, Stopped, with “Local bootstrap and relay is stopped” and the tile at A service is down. Last, a runtime drop-in makes it exit 1 at every start, so systemd restarts it every five seconds and reports it activating in between: it must read Failed, with “Local bootstrap and relay failed and systemd is restarting it”, its NRestarts above 1 and the tile at A service is down, the sentence first required to be absent while it is merely stopped. vmTestServices-noBootstrap is the same machine without the server: the services are the same less that one, no unit of it exists and no health reading is published. Two falsifiers in legacyPackages.falsifiers run the test expecting the server where it does not run and not expecting it where it does; both must fail.
A fleet is the monitor node naming its peers and every node exporting:
# the monitor node
services.holochain-grafana = {
  enable = true;
  openFirewall = true;
  # named sensorica-holoport-01 to sensorica-holoport-05 after their hosts; an attribute set
  # names them otherwise and gives each a site
  scrapeTargets = [
    "sensorica-holoport-01:9100" "sensorica-holoport-02:9100" "sensorica-holoport-03:9100"
    "sensorica-holoport-04:9100" "sensorica-holoport-05:9100"
  ];
};

# every node, monitor included
services.holochain-edgenode = {
  metricsExporter.enable = true;
  conductorMetrics.enable = true;
};
A conductor with no hApp installed joins no DHT, so its connection and byte counts sit at zero while holochain_conductor_up and holochain_conductor_peer_urls are already non-zero. That is the correct reading of a bare node, not a broken panel.
3. What the Wind Tunnel runner is, and is not
It is not a data source. Its only trace on the dashboards is one line among the node’s services, “Wind Tunnel runner”, saying whether its container runs. holochain-windtunnel runs ghcr.io/holochain/wind-tunnel-runner, whose entrypoint is
chronyd -q 'server pool.ntp.org iburst' 'makestep 1 -1'
exec nomad agent -config=<baked nomad.json> -config=/etc/nomad.d
and whose baked config sets client.servers = ["nomad-server-01.holochain.org"]. Both were read out of the pulled image. Enabling the module joins the machine to the Holochain Foundation’s Nomad cluster as a client, and the Foundation then schedules Wind Tunnel scenarios, each with its own conductor, onto it. Nothing in the image exposes a Prometheus endpoint: the image config declares no ports, and neither the README nor the repository mentions Prometheus or metrics. That is why windtunnelTargets was removed from the Grafana module rather than wired up.
So the module exists as an honest opt-in, a way to donate a spare machine to the Foundation’s test network, off by default, with the consequences written into its option description, and the fleet dashboard’s traffic comes from our own conductors instead.
The image publishes only the moving tags latest, latest-amd64 and latest-arm64, so the module’s default pins the multi-architecture index digest that latest resolved to on 2026-08-28. Re-pin it with skopeo inspect docker://ghcr.io/holochain/wind-tunnel-runner:latest.
The HTTP gateway
A browser cannot speak the conductor’s app websocket protocol, so reading a hApp from a web page means something in front of the conductor that turns an HTTP request into a zome call. That something is hc-http-gw, the Holochain Foundation’s own gateway, and modules/holochain-http-gateway.nix runs it.
The route is one GET per zome function:
GET /{dna-hash}/{installed-app-id}/{zome}/{fn}?payload=<base64url of a JSON document>
The gateway decodes the payload, transcodes it to msgpack, dispatches the call over an app websocket it opens through the admin API, and transcodes the reply back to JSON. 200 carries the zome’s answer, 403 means the app or the function is not on the allow list, 404 means no installed app matches the DNA hash and app id.
Not the bundled hc http-gw
Holonix’s hc ships an http-gw subcommand, and the first design (ADR-009) used it. It was replaced because the bundled build carries whatever gateway version that hc was cut with — 0.3.1 in the pinned holonix, on a hc from the 0.7 line — while upstream publishes one gateway release per Holochain line and the two are not compatible:
| Holochain | Gateway | Pinned here |
|---|---|---|
| 0.6.x | 0.3.x | v0.3.5 (holochain_client 0.8.3, holochain_types 0.6.3) |
| 0.7.x | 0.4.x | v0.4.0 (holochain_client 0.9.0, holochain_types 0.7.0) |
packages/holochain-http-gateway.nix builds the tagged source with rustPlatform.buildRustPackage and picks the release from the Holochain line, exactly as the network section does. Both are exposed as packages.<system>.holochain-http-gateway and holochain-http-gateway-0_6, so an operator can check which binary a node would run without evaluating a system.
The build uses the nixpkgs the matching holonix already pins rather than this flake’s own nixpkgs, so the gateway shares the conductor’s toolchain; this started because the crate’s rust-toolchain.toml asked for a rustc newer than nixos-25.05 carried. That adds no input to the lock.
Nothing is exposed by default
allowedAppIds defaults to [], which means the gateway starts, answers /health, and refuses every zome-call path. Exposing a function is two facts written down:
services.holochain-http-gateway = {
  enable = true;
  allowedAppIds = ["dino-adventure"];
  allowedFns.dino-adventure = ["dino_adventure/get_all_dinos_local"];
};
The gateway does nothing to tell a read from a write. allowedFns.<app> = ["*"] is accepted, because upstream accepts it, and raises an evaluation warning, because it publishes the app’s write functions to anything that can reach the port.
The first call after boot is slow
The conductor compiles a hApp’s wasm on its first zome call, and on a cold node that took 54 to 61 s in the VM tests. zomeCallTimeoutMs defaults to 10000, so a reader who curls the gateway right after boot may see one 500 before the cell is warm; the second call answers in milliseconds. Wait for holochain-happ-installer.service to finish and call once before pointing a demo at it.
Two implementation details worth knowing
The binary reads its configuration from the environment, and one of those variables carries the app id in its name: HC_GW_ALLOWED_FNS_<app-id>. systemd rejects an Environment= assignment whose name contains a dash, and app ids routinely contain dashes, so the module passes those through env in a small launch script and keeps the fixed-name variables in the unit’s environment where systemctl show can print them.
hc-http-gw --help does not work without HC_GW_ADMIN_WS_URL set: the program loads its configuration before clap prints anything, and exits with HC_GW_ADMIN_WS_URL is not set. The full variable list is in each option’s description in module-options.md.
The test
vmTestGateway installs Dino Adventure v0.3.0 on a real conductor, allows exactly one function, and drives the gateway over HTTP. get_all_dinos_local is a pure read taking no payload; get_all_dinos is its sibling in the same zome, equally a read, and deliberately left off the allow list. The 200 proves the whole path from HTTP to the zome and back; the 403 on a function that exists proves the allow list is what refuses it, not a missing route.
Test bundles
The VM tests install real, published hApps, fetched by hash and never committed (ADR-012):
| Test | Line | Bundle | sha256 |
|---|---|---|---|
vmTestWithHapp | 0.7.0 | Dino Adventure v0.3.0 | 4dd11f7c5f5ee73f9472827e48ab3538f53f37f819af610bf8de95c10ee74f72 |
vmTestWithHapp-0_6 | 0.6.3 | Kando v0.17.5 | a4cdee64fe32720077e0aade94630f24d0da5e91da33ccbe5bfd894d9d359f28 |
Open questions
See GitHub issues for outstanding implementation decisions:
- Secrets management for network seeds (sops-nix integration?)
- DHT data persistence across config changes
- Conductor version upgrade paths without state loss
- A production bootstrap and relay pair for either line, once the Foundation documents one. The
holochain-bootstrapmodule runs your own; it is tested over plain HTTP on a LAN, not yet with TLS.
Module options
Generated from the module declarations by nix build .#options-doc; do not edit by hand. CI fails when this file differs from a fresh build, so regenerate it in the same commit as any option change:
cp "$(nix build .#options-doc --print-out-paths)" docs/module-options.md
The prose about how the modules fit together lives in architecture.md.
services.holochain-bootstrap.enable
Whether to enable the Kitsune2 bootstrap and relay server (kitsune2-bootstrap-srv).
One process serves peer discovery at /bootstrap/{space} and an iroh
relay at /relay on the same port. Point conductors at it with
services.holochain-edgenode.bootstrapUrl = "http(s)://<host>:<port>"
and relayUrl = "http(s)://<host>:<port>/relay".
The relay is open: it has no authentication by default, so anyone who can reach the port can relay traffic through it. Keep it on a LAN or behind a firewall unless that is what you want. Its state is ephemeral and cannot be shared between instances, so run one server per network, not several behind a load balancer .
Type: boolean
Default:
false
Example:
true
Declared by:
services.holochain-bootstrap.package
The kitsune2-bootstrap-srv package. The flake’s module defaults it to
the holonix main-0.6 build (kitsune2 0.4.1), the line the Sensorica
fleet runs. A 0.7 network takes nixos-holochain.packages.${system}.bootstrap-srv
instead (kitsune2 0.5.0): keep the server on the same line as the
conductors that use it.
Type: package
Default:
nixos-holochain.packages.${system}.bootstrap-srv-0_6
Declared by:
services.holochain-bootstrap.extraArgs
Further kitsune2-bootstrap-srv flags, appended as given.
Type: list of string
Default:
[ ]
Example:
[
  "--max-entries-per-space"
  "64"
  "--allowed-origins"
  "https://example.org"
]
Declared by:
services.holochain-bootstrap.listenAddresses
Addresses the HTTP server binds, each on port. IPv6 addresses go in
brackets. The default [::] is dual-stack on Linux and accepts IPv4
as well; on a host with IPv6 disabled, use 0.0.0.0.
Do not list both 0.0.0.0 and [::], although that is the server’s
own production default. On Linux the second bind fails with “address
in use”, and the 0.4.1 server does not exit on a failed bind: it logs
nothing, listens on nothing and stays up, so systemd reports the unit
active. Seen in this repository’s VM test, not guessed.
Type: list of string
Default:
[
  "[::]"
]
Example:
[
  "192.168.1.10"
]
Declared by:
services.holochain-bootstrap.logLevel
RUST_LOG filter for the server. Its built-in default is debug,
which logs every request to the journal.
Type: string
Default:
"info"
Example:
"info,kitsune2_bootstrap_srv=debug"
Declared by:
services.holochain-bootstrap.openFirewall
Open port on TCP and quicPort on UDP. Conductors on other machines
cannot reach the server without this or an equivalent firewall rule.
Type: boolean
Default:
false
Declared by:
services.holochain-bootstrap.port
TCP port for bootstrap and relay, over HTTPS when a certificate is
configured and plain HTTP otherwise. The unit holds
CAP_NET_BIND_SERVICE so a port below 1024 works without root.
Type: 16 bit unsigned integer; between 0 and 65535 (both inclusive)
Default:
443
Declared by:
services.holochain-bootstrap.quicAddress
Address the QUIC address discovery (QAD) endpoint binds, which lets
iroh clients learn their public address. On Linux [::] also accepts
IPv4.
Type: string
Default:
"[::]"
Declared by:
services.holochain-bootstrap.quicPort
UDP port for QUIC address discovery; 7842 is iroh’s default.
Type: 16 bit unsigned integer; between 0 and 65535 (both inclusive)
Default:
7842
Declared by:
services.holochain-bootstrap.tlsCertFile
PEM certificate for HTTPS and for QUIC. A path as a string, read at
service start through systemd’s LoadCredential, so it never enters
the Nix store and may be readable by root only. Set it together with
tlsKeyFile.
Without it the server speaks plain HTTP, and QUIC uses a self-signed
certificate it generates at start. That is enough for a LAN of
edgenodes, which then need
services.holochain-edgenode.relayAllowPlainText = true. It is not
enough for a packaged Moss desktop: Moss enables plain-text relays only
in development builds, so a laptop running stock Moss needs this server
on HTTPS with a certificate it trusts.
The certificate is read once, at start: restart the unit after a renewal.
Type: null or string
Default:
null
Example:
"/var/lib/acme/bootstrap.example.org/fullchain.pem"
Declared by:
services.holochain-bootstrap.tlsKeyFile
PEM private key matching tlsCertFile, loaded the same way.
Type: null or string
Default:
null
Example:
"/var/lib/acme/bootstrap.example.org/key.pem"
Declared by:
services.holochain-bootstrap.workerThreads
Worker threads for the HTTP server. null keeps the server’s
production default, four per CPU. The workers block on file IO, which
is why the default exceeds the core count.
Type: null or (positive integer, meaning >0)
Default:
null
Declared by:
services.holochain-edgenode.enable
Whether to enable Holochain edgenode (conductor + lair + hApp installer).
Type: boolean
Default:
false
Example:
true
Declared by:
services.holochain-edgenode.package
Holochain conductor package. Its version selects the config schema the
module renders: below 0.7 the network section carries bootstrap_url,
signal_url and relay_url; from 0.7 it carries bootstrap_url and
relay_url, because signal_url was removed from the schema.
Type: package
Default:
inputs.holonix.packages.${pkgs.stdenv.hostPlatform.system}.holochain
Declared by:
services.holochain-edgenode.adminAllowedOrigins
Allowed origins for the admin WebSocket interface. The default is the
Origin header hc sends when given no --origin, which is what the
hApp installer and the metrics timer use, and which no browser sends:
with * any web page open in a browser on the node could drive the
admin API over ws://localhost. Widen it only for an admin UI you
trust.
Type: string
Default:
"holochain_websocket"
Declared by:
services.holochain-edgenode.adminPort
WebSocket port for the conductor admin interface (bound to localhost).
Type: 16 bit unsigned integer; between 0 and 65535 (both inclusive)
Default:
4444
Declared by:
services.holochain-edgenode.allowedOrigins
Allowed origins for the app WebSocket interface the installer attaches:
*, a single origin, or a comma-separated list.
Type: string
Default:
"*"
Declared by:
services.holochain-edgenode.appPort
WebSocket port the hApp installer attaches as the app interface.
Type: 16 bit unsigned integer; between 0 and 65535 (both inclusive)
Default:
8888
Declared by:
services.holochain-edgenode.binaryCache.enable
Declare the Holochain Foundation’s binary cache
(https://holochain-ci.cachix.org) in the host’s nix.settings, so
holochain and hc are downloaded prebuilt instead of compiled from
source. A flake’s own nixConfig does not reach a downstream flake
that imports this module, and without the cache a first
nixos-rebuild switch compiles the whole Holochain workspace
(seen on a homelab rehearsal, 2026-09-26).
The setting lands in nix.conf only once a switch has activated it,
so the very first switch that brings it still builds from source
unless it is run with
--option extra-substituters https://holochain-ci.cachix.org --option extra-trusted-public-keys <key>; see docs/deployment.md.
Type: boolean
Default:
true
Declared by:
services.holochain-edgenode.bootstrapUrl
Kitsune2 bootstrap server used for WAN peer discovery. null selects the
default for the configured line: https://dev-test-bootstrap2.holochain.org
below 0.7 (Holo-Host/edgenode’s 0.6.1 template) and the same URL with a
trailing slash from 0.7 (what holochain --create-config writes). No
production bootstrap URL is documented for either line, so point this at
your own infrastructure for a real deployment.
Type: null or string
Default:
null
Declared by:
services.holochain-edgenode.conductorMetrics.enable
Whether to enable a timer that exports the conductor’s own network stats as
holochain_* series through node_exporter’s textfile collector.
This is the fleet dashboard’s Holochain data source. It calls
dump-network-stats on the admin interface, which answers with
Kitsune2’s TransportStats on both the 0.6 and 0.7 lines, and derives
connection gauges and byte and message counters from it; it also
counts installed apps by status from list-apps. The counters are
running totals kept in conductor-metrics-counters.json under
dataDir, so a peer disconnecting does not pull them down. It also
calls dump-network-metrics --include-dht-summary and writes one
holochain_dht_* series set per DHT the conductor is in (peers, ops
held here and by the best peer, pending fetches, seconds since the
last gossip, completed rounds and timeouts), labelled app_id,
role and dna, and names every app and DHT in holochain_app_info
and holochain_dht_info from displayName and roleNames. Every
line carries conductor, from name. Requires
metricsExporter.enable
.
Type: boolean
Default:
false
Example:
true
Declared by:
services.holochain-edgenode.conductorMetrics.interval
How often the timer writes the textfile, as a systemd time span. The floor is what the dashboard’s resolution is worth: Prometheus scrapes node_exporter on its own schedule and simply re-reads whatever the file last said, so a value far above the scrape interval shows as a staircase rather than a curve.
Type: string
Default:
"30s"
Example:
"1min"
Declared by:
services.holochain-edgenode.conductorMetrics.name
The conductor label on every holochain_* series this node
writes, and the name dashboards show for the conductor. It keeps
two conductors on one machine apart (this one and a Moss node, say),
so give each its own.
Type: string
Default:
"Holochain"
Example:
"Workshop"
Declared by:
services.holochain-edgenode.dataDir
Persistent state directory for the conductor database, the lair keystore
and the generated passphrase. Created as the unit’s StateDirectory with
mode 0700.
Keep it short. The keystore’s unix socket is ${dataDir}/ks/socket and
unix socket paths are capped at 108 bytes (SUN_LEN); a deeper path makes
the conductor exit at startup with path must be shorter than SUN_LEN.
Type: absolute path
Default:
"/var/lib/holochain"
Declared by:
services.holochain-edgenode.dbSyncLevel
db_sync_level, the SQLite synchronous level, from 0.7 only (0.6 has
db_sync_strategy instead, which this module does not set). null
leaves the conductor default, Normal. Off trades crash safety for
speed. Ignored with a warning below 0.7.
Type: null or one of “Full”, “Normal”, “Off”
Default:
null
Declared by:
services.holochain-edgenode.happs
hApps to install and keep enabled, keyed by installed app id.
Type: attribute set of (submodule)
Default:
{ }
Example:
{
  dino-adventure = {
    src = pkgs.fetchurl {
      url = "https://github.com/holochain/dino-adventure/releases/download/v0.3.0/dino-adventure-v0.3.0.happ";
      sha256 = "...";
    };
    networkSeed = "workshop-2026";
  };
}
Declared by:
services.holochain-edgenode.happs.<name>.displayName
What dashboards call this app, as app_name on the
holochain_app_info and holochain_dht_info series. null
falls back to the bundle’s own name from list-apps, with
underscores and dashes read as spaces and the first letter
capitalised (requests_and_offers reads “Requests and
offers”).
Type: null or string
Default:
null
Example:
"Requests & Offers"
Declared by:
services.holochain-edgenode.happs.<name>.installed
Whether to install this hApp when absent and keep it enabled. Setting it to false (or removing the entry) stops managing the app; it does not disable or uninstall an app already installed.
Type: boolean
Default:
true
Declared by:
services.holochain-edgenode.happs.<name>.networkSeed
Network seed override for every DNA in this app.
Type: null or string
Default:
null
Declared by:
services.holochain-edgenode.happs.<name>.roleNames
What dashboards call each part of this app, keyed by DNA role,
as part_name on holochain_dht_info. A role left out reads
as nothing when the app has one role, so its network is shown
by the app’s name alone, and otherwise as the role id with a
one-letter prefix dropped and underscores read as spaces
(rFiles reads “Files”).
Type: attribute set of string
Default:
{ }
Example:
{
  hrea = "Accounting";
  requests_and_offers = "Listings";
}
Declared by:
services.holochain-edgenode.happs.<name>.src
Path to the .happ bundle. Fetch it by hash; never commit one (ADR-012).
Type: absolute path
Declared by:
services.holochain-edgenode.hcPackage
Holochain CLI package used by the hApp installer. Keep it on the same
line as package: the admin subcommand is hc client call from 0.7 and
hc sandbox call below it.
Type: package
Default:
inputs.holonix.packages.${pkgs.stdenv.hostPlatform.system}.hc
Declared by:
services.holochain-edgenode.installerTimeout
Seconds the hApp installer allows each of its waits: the admin interface answering at all, then, per hApp, the install and the enable settling. The conductor needs about 80 seconds to open the port on an unaccelerated VM, so leave room. The unit itself has no start timeout, so raising this is enough.
Type: signed integer
Default:
300
Declared by:
services.holochain-edgenode.metricsExporter.enable
Whether to enable Prometheus node_exporter for fleet observability.
Type: boolean
Default:
false
Example:
true
Declared by:
services.holochain-edgenode.metricsExporter.port
Port to expose node metrics on.
Type: 16 bit unsigned integer; between 0 and 65535 (both inclusive)
Default:
9100
Declared by:
services.holochain-edgenode.metricsExporter.textfileDirectory
Directory node_exporter’s textfile collector reads. Every *.prom
file in it is appended to /metrics verbatim, which is how metrics
that no exporter produces on its own reach Prometheus.
The directory is created 0755 and owned by user, so the conductor
metrics timer can write into it while node_exporter, which runs as
its own user, can read it.
Type: absolute path
Default:
"/var/lib/prometheus-node-exporter-text-files"
Declared by:
services.holochain-edgenode.openFirewall
Open firewall ports for the app and metrics interfaces. The admin port
is never opened. The conductor binds its websockets to localhost, so in
practice this matters for the metrics exporter, and for the app port
only if danger_bind_addr is configured by hand.
Type: boolean
Default:
false
Declared by:
services.holochain-edgenode.passphraseFileName
Name of the lair passphrase file inside dataDir. Generated with mode
0600 on first boot if absent and reused on every boot after that, which
is what lets the keystore open again after a reboot with nobody present.
Type: string
Default:
"lair-passphrase"
Declared by:
services.holochain-edgenode.relayAllowPlainText
Let the iroh transport use a plain-HTTP relay, by rendering
network.advanced.irohTransport.relayAllowPlainText: true. Kitsune2
refuses an http:// relay URL without it, so the conductor would not
start. Needed for a LAN services.holochain-bootstrap server without
TLS; leave it off for an https:// relay. Works on both lines.
Type: boolean
Default:
false
Declared by:
services.holochain-edgenode.relayUrl
Iroh relay used when a direct connection cannot be established. Required
by the conductor on both lines; null selects
https://use1-1.relay.n0.iroh-canary.iroh.link./, the default both
0.6.3 and 0.7.0 write for themselves.
For a services.holochain-bootstrap server this is
http(s)://<host>:<port>/relay: the same server as bootstrapUrl,
on the /relay path. A plain http:// relay also needs
relayAllowPlainText.
Type: null or string
Default:
null
Declared by:
services.holochain-edgenode.requestTimeoutS
network.request_timeout_s: seconds before a request and its response
time out. null leaves the conductor default, 60. Same key on both
lines.
Type: null or (positive integer, meaning >0)
Default:
null
Example:
90
Declared by:
services.holochain-edgenode.signalUrl
WebRTC signal server. Used only below 0.7, where null selects
wss://dev-test-bootstrap2.holochain.org. network.signal_url was
removed from the 0.7 config schema, so from 0.7 this option is ignored
and setting it raises a warning; use relayUrl instead.
Type: null or string
Default:
null
Declared by:
services.holochain-edgenode.useSystemdNotify
Run the conductor as Type = "notify", so the unit becomes active only
once the conductor has signalled readiness rather than as soon as the
process exists. Set to false to fall back to Type = "simple".
Type: boolean
Default:
true
Declared by:
services.holochain-edgenode.user
System user the conductor runs as.
Type: string
Default:
"holochain"
Declared by:
services.holochain-edgenode.wasmBackend
wasm_backend, from 0.7 only: which compiler runs zomes when the
Holochain binary was built with more than one. The conductor refuses a
backend it was not built with. null uses whichever is available.
Ignored with a warning below 0.7.
Type: null or one of “cranelift”, “LLVM”, “wasmi”
Default:
null
Declared by:
services.holochain-grafana.enable
Whether to enable Prometheus + Grafana observability for Holochain fleet.
Type: boolean
Default:
false
Example:
true
Declared by:
services.holochain-grafana.adminPassword
Grafana administrator password. The default is the workshop’s shared password, kept as a default so a fleet works out of the box on a lab network.
It ends up world-readable in the Nix store, so it is a lab convenience
and not a secret, and nixpkgs warns about it on every evaluation. On
anything reachable from outside the lab use adminPasswordFile, which
takes precedence over this option.
Type: string
Default:
"workshop2026"
Declared by:
services.holochain-grafana.adminPasswordFile
Path on the target machine to a file holding the Grafana administrator
password. When set it takes precedence over adminPassword, and the
password never enters the Nix store: systemd hands the file to Grafana
as a credential (LoadCredential), and Grafana reads it through a
$__file{...} reference.
Because systemd reads it, the file can stay owned by root with mode 0400, and it can be created before Grafana (or its user) exists. Create it on the node before the first deploy, for example:
sudo install -d -m 0700 /var/lib/secrets
sudo install -m 0400 /dev/null /var/lib/secrets/grafana-admin-password
printf '%s' 'the-password' | sudo tee /var/lib/secrets/grafana-admin-password > /dev/null
If the file is missing, grafana.service fails to start and its journal names the path.
The path must survive a reboot, so /run is the wrong place for it
unless a secrets manager repopulates it at boot.
Type: null or absolute path not in the Nix store
Default:
null
Example:
"/var/lib/secrets/grafana-admin-password"
Declared by:
services.holochain-grafana.adminUser
Grafana administrator account.
Type: string
Default:
"admin"
Declared by:
services.holochain-grafana.dashboards
Directory of Grafana dashboard JSON files to provision. Everything in
it is loaded at startup and re-read every 30 seconds. The module ships
five, each titled with the question it answers and all tagged
holochain: holochain-home (“What is this machine running?”),
Grafana’s home page, with each service’s state and version, each
conductor’s Holochain version and each app’s state; holochain-now
(“Is the Holochain network working?”), the room screen;
holochain-fleet (“Which Holochain node needs attention?”), for
whoever runs the fleet;
holochain-node (“Is this node working, app by app?”), one machine;
and holochain-network (“Is this app in step on every node?”), one
app network across every machine. They read the recording rules of
holochain-rules.nix, so they agree on every state.
For a directory in the Nix store, the module sets Grafana’s home page
(services.grafana.settings.dashboards.default_home_dashboard_path,
at default priority, so a definition of your own wins): its
holochain-home.json when it has one, with its node variable
defaulting to this machine (the name of the scrape target on a
loopback address, or at this machine’s host name or FQDN, else
networking.hostName), else its
holochain-now.json, otherwise a copy of Grafana’s own home page.
The choice is made while building, so a directory inside a package is
not built during evaluation.
A directory in the Nix store (a path in your flake, or a directory
inside a flake input or package such as "${inputs.x}/dashboards")
has every dashboard’s units textbox variable set from
overviewUnits on its way in, every field override matched by name
to name given the units’ names as value mappings, and the
room_app, room_part and room_label constants set from room
when that is set. Every threshold step that names a states option
in its fromOption key takes that option’s value, and the sentences
that quote a state’s threshold quote the value given, so the colours
and the words agree with the state the rules compute. A directory
outside the store, or a
store path written as a bare string that carries no Nix string
context, is provisioned as it is.
Type: absolute path
Default:
./dashboards
Declared by:
services.holochain-grafana.grafanaPort
Port Grafana listens on.
Type: 16 bit unsigned integer; between 0 and 65535 (both inclusive)
Default:
3000
Declared by:
services.holochain-grafana.openFirewall
Open firewall ports for Grafana, Prometheus, and node_exporter.
Type: boolean
Default:
false
Declared by:
services.holochain-grafana.overviewUnits
systemd units to watch on every node on top of the ones each node lists itself, each with the name a person reads for it. The keys are units, the values their names; a unit whose name is null, or an entry of a plain list of units, is shown by its unit name.
Every node lists its own services in
services.holochain-services.units, filled from the modules enabled
on it (the conductor, the HTTP gateway, the local bootstrap and relay,
the Wind Tunnel runner, Prometheus, Grafana, and the services beside
them), and publishes that list through node_exporter. This option is
for what a node does not list: a machine that does not run these
modules, or a unit of your own on every machine. Its default is empty,
so what is watched follows each node’s configuration.
Each key is a regular expression Prometheus matches against the whole
unit name, suffix included, so restic-backups-.* works, and its name
is given to every unit it matches. A unit is watched on each node that
runs it, and a node that does not run it has no row for it, so one set
serves a fleet whose machines run different things. A unit a node
lists itself keeps the name the node gives it.
The watched units reach the recording rules (holochain:service_watched
and holochain:service_state), which the node page’s “Is each
service on this machine running?”, the fleet page’s “Which services
are not running?” and the room screen’s machine tiles read. For a dashboard of your own, the
keys are also joined with | into the default of any units textbox
variable, and every field override matched by name to name (the
unit label of node_systemd_unit_state) gets one regex value mapping
per named unit.
The holochain:node_problem rule, which the problem lists read, gives
every failed unit on the node a sentence of its own whether it is
watched or not, except device, scope and slice units, which the
node_exporter flags these modules set leave out, naming it by its
watched name or, when it has none, by its unit name.
Type: (attribute set of (null or string)) or (list of string) convertible to it
Default:
{ }
Example:
{
  "caddy.service" = "Web server";
  "restic-backups-.*" = "Backups";
}
Declared by:
services.holochain-grafana.prometheusPort
Port Prometheus listens on.
Type: 16 bit unsigned integer; between 0 and 65535 (both inclusive)
Default:
9090
Declared by:
services.holochain-grafana.room
The one app part a room screen follows writes in. Rendered into the
constant variables room_app, room_part and room_label of every
provisioned dashboard that declares them; when null, those variables
keep the defaults their dashboard gives them.
An app installed by hand in Moss is not a good choice: its id changes
with every installation and holds $, which Grafana reads as a
variable.
Type: null or (submodule)
Default:
null
Declared by:
services.holochain-grafana.room.app
The installed_app_id of an app this module’s fleet installs from Nix.
Type: string
Example:
"requests-and-offers"
Declared by:
services.holochain-grafana.room.label
The name the room screen gives that app.
Type: string
Example:
"Requests & Offers"
Declared by:
services.holochain-grafana.room.part
The role of the app whose writes the room follows.
Type: string
Example:
"requests_and_offers"
Declared by:
services.holochain-grafana.scrapeInterval
How often Prometheus scrapes its targets. Prometheus itself defaults to
one minute, which for a lab fleet of a handful of nodes draws a
fifteen-minute window as about fifteen points, and makes rate() over
a short range flat or empty. The conductor metrics timer writes every
30 s by default, so this is deliberately below it.
Type: string
Default:
"15s"
Declared by:
services.holochain-grafana.scrapeTargets
The node_exporter of every node Prometheus scrapes, and the name each
node goes by on the dashboards. Prometheus attaches the name to every
series from the target as the node label, so a node that is down is
still shown by its name.
As an attribute set, each key is the node’s name, and the value gives
its address (host:port) and, optionally, its site, which becomes a
site label. As a list of host:port strings, each node is named after
the host part of its address, except that a loopback address
(127.0.0.1, localhost, ::1) takes this machine’s
networking.hostName. A list entry given by an IP address therefore
goes by that address on every dashboard, and evaluation warns about
it: give such a node a name with the attribute set form.
No two targets may go by the same name: the dashboards aggregate by
node, so two targets named alike would read as one machine. Two
list entries on one host (two ports of a loopback, say) need the
attribute set form.
Type: (list of string) or attribute set of (submodule)
Default:
[ ]
Example:
{
  lab-1 = { address = "sensorica-holoport-01:9100"; site = "Sensorica lab"; };
  lab-2 = { address = "sensorica-holoport-02:9100"; site = "Sensorica lab"; };
  homelab.address = "100.64.0.7:9100";
}
Declared by:
services.holochain-grafana.secretKeyFile
Path on the target machine to a file holding Grafana’s
security.secret_key, the key it encrypts data source secrets with.
Since NixOS 26.05 Grafana has no default key and refuses to evaluate
without one.
When null, the module generates a random key once, at first boot, in
${services.grafana.dataDir}/secret_key (mode 0400, owned by
grafana) and keeps it across rebuilds, so the key never enters the
Nix store. Set this only to share one key between machines or to
restore one from a backup; like adminPasswordFile, it is handed over
by systemd and can stay root-owned.
Type: null or absolute path not in the Nix store
Default:
null
Example:
"/var/lib/secrets/grafana-secret-key"
Declared by:
services.holochain-grafana.states.historyWindow
How far back, as a Prometheus duration, a DHT with no peer is remembered to have had one. Within it the DHT reads “Lost contact”; a DHT that had nobody in all of it, on a DNA no other node of the fleet runs, reads “No one else yet”, which is normal for a node that is alone.
Type: string matching the pattern [0-9]+(ms|s|m|h|d|w|y)
Default:
"24h"
Declared by:
services.holochain-grafana.states.inStepShare
The share of its best peer’s data a connected DHT must hold, on
average over shareWindow, to read “In step” rather than “Catching
up”. A healthy DHT rarely holds everything its best peer does, since
new data is always on its way, so 1 would read a working network as
behind for good; 0.95 is what the Sensorica Moss node’s DHTs held on
2026-09-27.
Type: integer or floating point number between 0 and 1 (both inclusive)
Default:
0.95
Declared by:
services.holochain-grafana.states.shareWindow
The window, as a Prometheus duration, the held share is averaged over, so a DHT does not flap between “In step” and “Catching up” at every write.
Type: string matching the pattern [0-9]+(ms|s|m|h|d|w|y)
Default:
"10m"
Declared by:
services.holochain-grafana.states.silentAfterSeconds
How long a DHT that knows peers may go without gossiping with any of them before it reads “Lost contact”.
Type: positive integer, meaning >0
Default:
600
Declared by:
services.holochain-grafana.states.staleAfterSeconds
How old a conductor’s readings may get before every DHT of it reads
“No fresh readings” and its conductor state reads stale. The default
covers the metrics timer’s 30 s interval plus the 15 s scrape, with
margin; raise it with conductorMetrics.interval.
Type: positive integer, meaning >0
Default:
90
Declared by:
services.holochain-http-gateway.enable
Whether to enable the Holochain HTTP gateway in front of the local conductor.
Type: boolean
Default:
false
Example:
true
Declared by:
services.holochain-http-gateway.package
The hc-http-gw package to run. The default is built from the tagged
upstream source for the Holochain line the conductor runs, so it does
not have to be set by hand when the conductor’s line changes.
Type: package
Default:
the hc-http-gw release matching services.holochain-edgenode.package.version: 0.4.x for Holochain 0.7, 0.3.x for 0.6
Declared by:
services.holochain-http-gateway.address
Address the gateway binds to, passed as --address (HC_GW_ADDRESS).
The default keeps it on loopback; set it to 0.0.0.0 and turn on
services.holochain-http-gateway.openFirewall to serve a LAN.
Type: string
Default:
"127.0.0.1"
Declared by:
services.holochain-http-gateway.adminPort
Admin websocket port of the conductor the gateway drives. It becomes
HC_GW_ADMIN_WS_URL=ws://127.0.0.1:<adminPort>, which the binary
requires: without it the process exits immediately.
Type: 16 bit unsigned integer; between 0 and 65535 (both inclusive)
Default:
config.services.holochain-edgenode.adminPort
Declared by:
services.holochain-http-gateway.allowedAppIds
Installed app ids the gateway is allowed to reach, joined into
HC_GW_ALLOWED_APP_IDS. Empty, the default, exposes nothing: the
gateway runs and refuses every zome-call path. Each id listed here
needs a matching entry in
services.holochain-http-gateway.allowedFns.
Type: list of string
Default:
[ ]
Example:
[
  "dino-adventure"
]
Declared by:
services.holochain-http-gateway.allowedFns
Per app id, the zome functions the gateway may call, written
zome_name/fn_name. Each entry becomes
HC_GW_ALLOWED_FNS_<app-id>, a comma separated list.
The single-element list ["*"] allows every function in every zome of
that app, which the binary accepts but which also exposes the app’s
writes, since the gateway does nothing else to tell a read from a
write. Using it raises an evaluation warning. * cannot be mixed with
named functions; the binary would fail to parse the value.
Type: attribute set of list of string
Default:
{ }
Example:
{
  dino-adventure = ["dino_adventure/get_all_dinos_local"];
  my-app = ["*"];
}
Declared by:
services.holochain-http-gateway.maxAppConnections
How many app websocket connections the gateway keeps open at once, one
per allowed app, as HC_GW_MAX_APP_CONNECTIONS. Older connections are
closed when the limit is reached.
Type: unsigned integer, meaning >=0
Default:
50
Declared by:
services.holochain-http-gateway.openFirewall
Open services.holochain-http-gateway.port in the firewall.
Leave it off unless the gateway is meant to be reachable from other
machines; the conductor’s admin interface is reachable through
anything the gateway is allowed to call.
Type: boolean
Default:
false
Declared by:
services.holochain-http-gateway.payloadLimitBytes
Largest accepted payload query parameter, in bytes, as
HC_GW_PAYLOAD_LIMIT_BYTES. Measured on the base64 text before it is
decoded, so it is really a cap on the URL length the gateway will
process. Upstream’s own default is the same 10 KiB.
Type: unsigned integer, meaning >=0
Default:
10240
Declared by:
services.holochain-http-gateway.port
Port the gateway listens on, passed as --port (HC_GW_PORT).
Type: 16 bit unsigned integer; between 0 and 65535 (both inclusive)
Default:
8090
Declared by:
services.holochain-http-gateway.zomeCallTimeoutMs
Deadline for a single zome call, in milliseconds, as
HC_GW_ZOME_CALL_TIMEOUT_MS. A call that outruns it answers 500.
Type: unsigned integer, meaning >=0
Default:
10000
Declared by:
services.holochain-services.healthChecks
Health checks, keyed by the unit they check, which should also be in
units. A timer runs every one every 30 seconds and writes
holochain_service_healthy (1 or 0) and
holochain_service_health_timestamp_seconds to
holochain-service-health.prom in textfileDirectory. A service
whose unit is active reads Not answering on the dashboards when its
check fails, and No fresh readings when the last check is older than
services.holochain-grafana.states.staleAfterSeconds. The bootstrap
module adds its /health here.
Type: attribute set of (submodule)
Default:
{ }
Declared by:
services.holochain-services.healthChecks.<name>.insecure
Accept any TLS certificate. For a check that reaches a service by its loopback address while its certificate names the host.
Type: boolean
Default:
false
Declared by:
services.holochain-services.healthChecks.<name>.timeoutSeconds
How long the check waits for an answer before it reads the service as not answering.
Type: positive integer, meaning >0
Default:
5
Declared by:
services.holochain-services.healthChecks.<name>.url
A URL that answers with a success status while the service works.
Type: string
Example:
"http://127.0.0.1:443/health"
Declared by:
services.holochain-services.textfileDirectory
The directory node_exporter’s textfile collector reads on this
machine, where the list of services and the health readings are
written. Set by services.holochain-edgenode when its
metricsExporter is on, and by services.holochain-grafana on a
monitor; on another machine that runs node_exporter with a textfile
collector of its own (a machine that only runs the bootstrap server,
say), set it to that collector’s directory. Null writes nothing, and
that machine’s services are then missing from the dashboards.
Type: null or string
Default:
null
Example:
"/var/lib/prometheus-node-exporter-text-files"
Declared by:
services.holochain-services.units
The systemd units this node runs that the Holochain dashboards watch,
each with the name a person reads for it; a value is that name, or
{ name; conductor; version; holochainVersion; }, where version is
the version of the package the unit runs and the last two are for a
unit that runs a conductor.
Filled from the configuration: every nixos-holochain module that is
enabled adds the units it creates (the conductor, the app installer
when there are apps, the conductor readings timer when
conductorMetrics is on, the HTTP gateway, the local bootstrap and
relay, the Wind Tunnel runner, and on a monitor Prometheus and
Grafana), and, on a machine where any of them is enabled, the
services beside them that are enabled here: node_exporter, sshd,
Tailscale and the Nix daemon’s socket. Each module also gives the
version of the package it runs the unit from, so the home page can
say what runs, in which version, without asking the machine. Add a
unit of your own the way any attribute set option merges; override a
name with lib.mkForce on that one attribute.
Published as holochain_service_info through node_exporter’s textfile
collector when textfileDirectory is set. The home page’s “Is each
service running, and in which version?” lists each of them with its
state and version, the node page’s “Is each service on this machine
running?” with its state,
the fleet page lists the ones that are not running, and the room
screen’s machine tile reads “A service is down” while one has failed,
keeps failing and restarting, has stopped or does not answer. A unit
systemd does not run has no row; evaluation warns about a listed unit
this configuration does not define.
services.holochain-grafana.overviewUnits, on the monitor, adds units
to watch on every node on top of these.
Type: attribute set of ((submodule) or string convertible to it)
Default:
{ }
Example:
{
  "caddy.service" = "Web server";
  "moss-node-metrics.timer" = "Moss readings (timer)";
}
Declared by:
services.holochain-services.units.<name>.conductor
For a unit that runs a Holochain conductor, the conductor label
its readings carry (services.holochain-edgenode.conductorMetrics.name
for an edgenode). The service then reads Not answering when the
conductor does not answer its admin interface, and No fresh
readings when its readings are old, although systemd says the
unit is active. A conductor that no listed unit claims is shown
as a service of its own, “Holochain conductor (<conductor>)”, as
the edgenode names the unit that runs a conductor under a name
other than the default: a Moss node whose readings carry
conductor="Moss" reads “Holochain conductor (Moss)”.
Type: null or string
Default:
null
Example:
"Workshop"
Declared by:
services.holochain-services.units.<name>.holochainVersion
For a unit that runs a Holochain conductor, the Holochain version
that conductor is, published as the holochain_version label.
It differs from version when the unit runs another program
that brings its own Holochain, as a Moss node does.
Type: string
Default:
""
Example:
"0.6.1"
Declared by:
services.holochain-services.units.<name>.name
The name a person reads for the unit on the dashboards.
Type: string
Example:
"Local bootstrap and relay"
Declared by:
services.holochain-services.units.<name>.version
The version of what the unit runs, from the package the module
runs it from, never guessed at runtime; published as the
version label. Empty when the unit has none worth naming (a
readings timer, a container pulled by digest), which the home
page shows as a dash.
Type: string
Default:
""
Example:
"0.6.3"
Declared by:
services.holochain-windtunnel.enable
Donate this machine to the Holochain Foundation’s Wind Tunnel test network.
The container runs its own Holochain conductor and reports to the
Foundation’s Nomad cluster at nomad-server-01.holochain.org; the
runner’s own README calls these machines “designed to be for internal
use only” and warns that the image “requires extensive permissions on
the host machine that are effectively root access” and “should only be
run on a dedicated machine”.
Enabling this donates the machine. It does not feed the fleet
dashboard: the holochain_* series come from
services.holochain-edgenode.conductorMetrics, and nothing in this
module exposes a Prometheus endpoint. Off by default, deliberately.
Type: boolean
Default:
false
Example:
true
Declared by:
services.holochain-windtunnel.autoStart
Start the container at boot. Set to false to keep the unit generated but idle, which is what the VM test does: the test sandbox has no network, so the image cannot be pulled there.
Type: boolean
Default:
true
Declared by:
services.holochain-windtunnel.backend
OCI backend used to run the container. Podman is the default: it needs no daemon and the NixOS module wires the unit to it directly. The runner’s README documents Docker, and the image is indifferent to which one starts it.
Type: one of “podman”, “docker”
Default:
"podman"
Declared by:
services.holochain-windtunnel.extraOptions
Flags passed to podman run / docker run. The default is the set the
runner’s README requires: host networking, privileged, and the host
cgroup namespace, so the Nomad agent inside can schedule and supervise
its own workloads. Removing any of them stops the runner from working;
they are an option only so that a host with a conflicting device or
network setup can adjust them knowingly.
Type: list of string
Default:
[
  "--net=host"
  "--privileged"
  "--cgroupns=host"
]
Declared by:
services.holochain-windtunnel.hostname
Hostname the container reports to the Nomad cluster, passed as
--hostname. The runner’s README asks for a unique, recognisable
nomad-client-<user> style name, since it is how the machine is
identified in the Nomad and Tailscale dashboards.
Type: string
Default:
"nomad-client-${config.networking.hostName}"
Declared by:
services.holochain-windtunnel.image
Runner image, pinned by digest.
ghcr.io/holochain/wind-tunnel-runner publishes only the moving tags
latest, latest-amd64 and latest-arm64, so a tag pin would silently
change what a fleet runs. The default is the multi-architecture index
digest that latest resolved to on 2026-08-28, which keeps amd64 and
arm64 hosts on the same pin. Re-pin with
skopeo inspect docker://ghcr.io/holochain/wind-tunnel-runner:latest
Type: string
Default:
"ghcr.io/holochain/wind-tunnel-runner@sha256:650c91806275681bc1961e0e55e85fa7fbf31bebe0c8665fc0a6af71ac330fa2"
Declared by:
A Holochain edgenode
One conductor on one machine, built from the nixos-holochain modules. Generated by nix flake init -t github:Sensorica/nixos-holochain#minimal.
Files
flake.nix— inputs and theedgenodeNixOS configuration.configuration.nix— the machine: hostname, operator account,services.holochain-edgenode.hardware-configuration.nix— a placeholder so the flake evaluates before the machine exists.
First steps
- Paste your SSH public key into
users.users.operator.openssh.authorizedKeys.keysinconfiguration.nix. - On the target machine, replace the placeholder hardware configuration with the real one. Nothing in the placeholder needs keeping: the boot loader is set in
configuration.nix.sudo nixos-generate-config --show-hardware-config > hardware-configuration.nix - Check it evaluates, then deploy:
nix flake check --no-build sudo nixos-rebuild switch --flake .#edgenode - Give
operatora password on the console (sudo passwd operator) if you want it to use sudo over SSH.
Firmware assumption
configuration.nix boots with systemd-boot, which is what the NixOS installer sets up on a UEFI machine with its ESP at /boot. On a legacy-BIOS machine replace the two boot.loader lines with GRUB (boot.loader.grub = { enable = true; device = "/dev/sda"; };). The #fleet template carries a GRUB layout that boots the same disk under both firmwares, built for Holoports.
Installing a hApp at boot
Uncomment the happs block in configuration.nix. Bundles are installed once, on first boot, by an idempotent installer service; networkSeed puts the app on its own network.
services.holochain-edgenode.happs.my-app = {
  src = ./my-app.happ;
  networkSeed = "my-network-2026";
};
What is running
systemctl status holochain-conductor.service
hc client call --port 4444 list-apps
The admin interface listens on 4444 and the app interface on 8888, both on loopback. The admin port is never opened in the firewall; openFirewall = true opens the app port and, with metricsExporter.enable, the node_exporter port.
More
- Full option reference:
docs/module-options.md - Observability, an HTTP gateway and a five-node fleet:
nix flake init -t github:Sensorica/nixos-holochain#fleet
A Holochain edgenode fleet
Five nodes built from the nixos-holochain modules, node-01 doubling as the Grafana monitor node, plus a live ISO to install them from. Generated by nix flake init -t github:Sensorica/nixos-holochain#fleet.
Layout
.
├── flake.nix                      # inputs, the five nixosConfigurations, the ISO, the colmena hive
├── hosts/
│   ├── common.nix                 # shared by every host: user, SSH keys, desktop, edgenode service
│   ├── node-01/
│   │   ├── configuration.nix      # monitor node: adds Grafana and Prometheus
│   │   └── hardware-configuration.nix   # placeholder, replace per machine (below)
│   ├── node-02 … 05/              # peer nodes: hostname + hardware only
│   └── live-iso/configuration.nix # KDE Plasma live ISO
└── README.md
First steps
- Rename the
hosts/node-0*directories and thehostslist inflake.nixto your machines’ names, and updatenetworking.hostNamein eachconfiguration.nixand thescrapeTargetslist innode-01. - Paste your SSH public key into the
operatorKeyslist at the top ofhosts/common.nix; it goes on theoperatoraccount and on root, which Colmena connects as. A fleet deployed with that list empty has no way in over SSH. - Replace each placeholder
hardware-configuration.nix(see below).
Evaluate
nix flake check --no-build
nix eval .#nixosConfigurations.node-01.config.system.build.toplevel.drvPath
Hardware configuration
Each host ships a placeholder hardware-configuration.nix so the fleet evaluates before any machine exists. Before deploying to real hardware, generate the real one on that machine and commit it over the placeholder:
sudo nixos-generate-config --show-hardware-config > hosts/node-01/hardware-configuration.nix
Nothing needs keeping from the placeholder: nixos-generate-config --show-hardware-config writes filesystems and kernel modules, never a boot loader, and the GRUB block that serves both firmwares lives in hosts/common.nix.
Firmware assumption
The placeholder targets a machine that may boot legacy BIOS or UEFI, because the fleet this template came from is built on Holoports (legacy BIOS only) and installed from laptops that are usually UEFI. So the disk is GPT with a 1 MiB bios_grub partition and a vfat ESP labelled boot, an ext4 root labelled nixos and a swap partition labelled swap, and GRUB is installed twice:
- the UEFI half by NixOS from
boot.loader.grubinhosts/common.nix(device = "nodev",efiSupport,efiInstallAsRemovable, ESP mounted at/efi-boot); - the BIOS half by one command in the install runbook,
grub-install --target=i386-pc --boot-directory=/mnt/boot /dev/sda.
efiInstallAsRemovable writes EFI/BOOT/BOOTX64.EFI, so firmware that keeps no boot variables still finds it. If your machines are UEFI only you can drop the bios_grub partition and the i386-pc command; if they are BIOS only, the ESP and the EFI half are what you drop. Layout and both commands after holochain/wind-tunnel-runner (base-install.nix, installer.nix); the whole partition, install and grub-install sequence is one command, nix run github:Sensorica/nixos-holochain#holoport-install -- DISK FLAKE#HOST, written up in the upstream docs/deployment.md § “Installing on a Holoport (legacy BIOS)”.
Deploy
# one machine
sudo nixos-rebuild switch --flake .#node-01

# the whole fleet over SSH, in parallel
nix develop            # brings colmena into PATH
colmena apply --impure --on @all
colmena apply --impure --dry-run
--impure is required with Colmena 0.4.0 on Nix 2.25: Colmena wraps the flake as an input named hive, and pure mode refuses to lock it (cannot update unlocked flake input 'hive' in pure mode). Colmena resolves nixos-holochain from this directory’s flake.lock, so --override-input does not reach it; run nix flake update nixos-holochain to deploy modules newer than the locked revision.
Live ISO
nix build .#nixosConfigurations.live-iso.config.system.build.isoImage
sudo dd if=result/iso/*.iso of=/dev/sdX bs=4M status=progress
sync
Monitoring
node-01 serves Grafana on :3000 with the five Holochain dashboards provisioned, “What is this machine running?” as its home page, scraping every node’s node_exporter and the conductor metrics timer. It logs in as admin with the password in /var/lib/secrets/grafana-admin-password, which you create on the node before the first deploy (root-owned, mode 0400; systemd hands it to Grafana); services.holochain-grafana.adminPasswordFile in the option reference gives the commands. The module’s adminPassword default is a lab convenience and lands world-readable in the Nix store, so it is not used here.
Option reference
Every option used here is documented in docs/module-options.md in the module repository.
happs/
.happ bundles are not committed to this repository (ADR-012). Nothing in the flake reads from this directory any more; it exists to document where bundles come from and how to point the module at one.
Referencing a hApp
Fetch it by hash, so the configuration is reproducible and the bundle stays out of git:
services.holochain-edgenode.happs = {
  dino-adventure = {
    src = pkgs.fetchurl {
      url = "https://github.com/holochain/dino-adventure/releases/download/v0.3.0/dino-adventure-v0.3.0.happ";
      sha256 = "4dd11f7c5f5ee73f9472827e48ab3538f53f37f819af610bf8de95c10ee74f72";
    };
    networkSeed = "workshop-2026";
  };
};
The attribute name is the installed app id: it is what install-app --app-id is given and what list-apps reports back.
To get the hash of a bundle you have not used before:
nix-prefetch-url --type sha256 <url>   # base32
# or, from a local file
sha256sum <file>
Bundles the VM tests use
Both are published releases, fetched by hash in flake.nix:
| Bundle | Line | Used by | sha256 |
|---|---|---|---|
| Dino Adventure v0.3.0 | 0.7.0 | checks.vmTestWithHapp | 4dd11f7c5f5ee73f9472827e48ab3538f53f37f819af610bf8de95c10ee74f72 |
| Kando v0.17.5 | 0.6.3 | checks.vmTestWithHapp-0_6 | a4cdee64fe32720077e0aade94630f24d0da5e91da33ccbe5bfd894d9d359f28 |
Neither test is conditional. An earlier version of vmTestWithHapp was gated on builtins.pathExists ./happs/windtunnel.happ, which meant it silently did not exist: a flake only sees git-tracked files, and *.happ is gitignored.
Workshop bundles
The Sensorica workshop fleet runs hREA, Kando and Requests & Offers on the 0.6 line (ADR-015), fetched by hash in modules/sensorica-happs.nix and installed by the sensorica-event-node profile. Versions and bundles are listed once, in the Sensorica fleet README (examples/sensorica-fleet/README.md, “Holochain line and hApps”). Participants join the Sensorica Moss group from their own laptop with Moss, and the group’s always-online node runs on the monitor Holoport (holochain-moss-node). Wind Tunnel is not a workshop bundle: the holochain-windtunnel module lends a machine to the Foundation’s test cluster and feeds nothing to Grafana.
Check each project’s releases for a bundle built against the Holochain line the fleet runs. As of this writing Wind Tunnel, hREA, Requests & Offers and Nondominium all still publish 0.6.x bundles; only Moss 0.16-dev targets 0.7.
Moss always-online node
A Moss group stays reachable when at least one member is online. wdocker is Moss’s headless node: a Holochain conductor plus a daemon that joins a group, answers Moss’s presence pings and installs the group’s tagged tools. This page runs it two ways: as a NixOS service (#28), which is how the Sensorica Holoports run it, and by hand on any x86_64 Linux machine with Nix.
As a NixOS service
nixosModules.holochain-moss-node (modules/holochain-moss-node.nix) runs wdocker’s daemon under systemd, with no terminal and no tmux. It is not part of nixosModules.default, because it runs a second conductor beside the edgenode’s. The flake’s wrapper sets its package to wdocker-0_15 (Moss 0.15.8, Holochain 0.6.1). It needs services.holochain-edgenode with its metricsExporter enabled, since the Moss readings go through the same exporter and textfile directory; an assertion says so when they are missing.
services.holochain-moss-node = {
  enable = true;
  name = "sensorica";
  passwordFile = "/var/lib/secrets/moss-node-password";
  group = "Sensorica";
  dashboard.title = "Is the Sensorica group always online?";
};
The options:
enable: the node, its readings timer and its unit names on the dashboards. The home page (“What is this machine running?”) lists the node as “Moss node” with wdocker’s version, and its conductor “Moss” with the Holochain wdocker brings (0.15.8 and 0.6.1 for the flake’swdocker-0_15), both read from the package, not from the running node.name: the wdocker conductor’s name, a local label (defaultmoss-node).passwordFile: a root-only file holding the conductor password, with no trailing newline. Only the path reaches the Nix store; systemd passes the file to the daemon as a credential (LoadCredential) and the daemon reads it on stdin. When the file is missing the unit fails withstatus=243/CREDENTIALSand retries every 30 s.group: what the dashboards call the Moss group itself (everygroup#app), from the exporter’s second run on.appletNames: what the dashboards call each tool, keyed by its installed_app_id (applet#..., asmoss-node statusprints it). A named tool is also expected, so it reads “Not running” when the conductor stops listing it; a tool left out reads by its kind and a number (Vines 1, Vines 2).partNames: what the dashboards call each part (DNA role) of each kind of Moss app, keyed by kind. The defaults name the group’sgroup,foyerandassetsroles and Vines’rVinesandrFiles.dashboard.enable: provision the Moss page in this machine’s Grafana. It defaults toconfig.services.grafana.enable, so the monitor node gets the page even when it runs no Moss node; the page lists every Moss node its Prometheus scrapes.dashboard.title: the page’s title. The page’s uid issensorica-moss-node; it is taggedmoss, which is how the home page finds it to link to it.
What it runs:
- The service
moss-node.servicerunswdaemon NAMEas the system usermoss-node, withHOME=/var/lib/moss-node(the state directory, mode 0700). The daemon creates the conductor on its first start; wdocker keeps it under/var/lib/moss-node/.local/share/wdocker/0.15.x/. The unit restarts on failure after 30 s. - The helper
moss-node, run as root:moss-node join "INVITE_LINK"runswdocker join-groupas the node’s user (it asks for the conductor password, a profile name and a description) and then restarts the service, because the daemon pings Moss only for the groups present when it starts. Start the line with a space so the link stays out of shell history.moss-node statusprints the unit’s state, the conductor, its groups and its apps;moss-node logsfollows the journal;moss-node restartrestarts the daemon;moss-node wdocker ARGS...runs any wdocker command as the node’s user. - The timer
moss-node-metrics.timerruns nixos-holochain’s own conductor exporter every 30 s under the conductor nameMoss, intomoss-node.promin the edgenode’s textfile directory, beside the edgenode’s own file (one program, one set of HELP texts, #47). wdocker picks a random admin port and allowed origin at every start and writes both into its conductor config, so the exporter reads them from there on every run. The unit reads as “Moss node” and the timer as “Moss readings (timer)” on the node page.
Joining is the one step that stays at a terminal, because the invite link carries the group’s network seed, which must never reach a file. Per machine, once: write the password file, then join.
printf '%s' "$(systemd-ask-password 'Moss conductor password:')" | install -m 0400 /dev/stdin /var/lib/secrets/moss-node-password
moss-node join "INVITE_LINK"
INVITE_LINK is an invite from the group in Moss (group settings), in double quotes.
The checks: checks.x86_64-linux.vmTestMossNode starts the service in a VM with no terminal, waits for “Daemon ready.”, checks the user, the helper, the holochain_conductor_up{conductor="Moss"} 1 reading and a restart, and boots a second machine without the password file that must never reach “Daemon ready.”; checks.x86_64-linux.moss-dashboard and checks.x86_64-linux.moss-names check the page and the names program, each also run on broken copies of its input that it must reject.
By hand
The rest of this page runs the packaged wdocker by hand, which is what the service automates. It is still the way to try a group on a machine that is not NixOS.
What the package is
packages.x86_64-linux.wdocker-0_15 builds wdocker from the Moss monorepo at tag v0.15.8 (the release whose desktop app bundles Holochain 0.6.1), not from npm: @theweave/wdocker@0.15.4 on npm cannot start, because its manifest still points at file: workspaces that are not published.
It ships the Holochain 0.6.1 binary wdocker expects, fetched from the Holochain release and pinned to the sha256 Moss itself pins in holochain-checksums.json. The binary is patched for the Nix store, so NixOS needs no nix-ld, and wdocker never downloads a binary at runtime: the wrapper sets WDOCKER_HOLOCHAIN_BINARY to it. Setting that variable yourself points wdocker at another binary.
wdocker --version prints 0.15.4, the version in wdocker’s own package.json at that tag.
Running it
Every command except the daemon prompts on a TTY (@inquirer/prompts), so run the node inside tmux or screen:
nix shell github:Sensorica/nixos-holochain#wdocker-0_15
wdocker run NAME
run creates the conductor, asks for a new password and stays attached, printing the daemon’s log. NAME is any local label. In a second pane, join the group with an invite link from Moss, in double quotes; it asks for the conductor password, a profile name and a description for the node:
wdocker join-group NAME "INVITE_LINK"
The invite link carries the group’s network seed (the part before &progenitor=). Do not commit it, paste it into an issue, or leave it in shell history (a leading space keeps it out when HISTCONTROL=ignorespace).
Then restart the node. The daemon sets up the ping and pong that make Moss show the node online only for groups that are present when it starts (wdocker/src/daemon/daemon.ts, lines 124 to 189 at v0.15.8). A group joined afterwards is hosted, but shows offline in Moss until the next start. Stop the attached wdocker run or wdocker start with Ctrl-C, then:
wdocker start NAME
Check the state with wdocker list, wdocker list-groups NAME and wdocker list-apps NAME. The group’s DNA hash in list-groups is the group’s id.
Tools are joined only when tagged
The daemon checks the group every five minutes and installs only the tools a steward has marked for always-online nodes: in Moss, group settings, Group Tools, the tool’s card, “always-online nodes should install this tool”. In the code, it keeps the applets whose metadata carries the always-online tag (daemon.ts lines 294 to 295, the tag defined in shared/group-client/src/types.ts line 163). An untagged tool is never installed on the node.
A tagged tool can still fail with sha256 of the fetched webhapp does not match when the webhapp at the tool list’s URL is not the build the group recorded. wdocker skips the download when happs/<sha256>.happ already holds the right bytes, and a Moss desktop keeps its installed tools the same way (data/happs/<sha256>.happ), so copying a member’s stored hApp into the node’s happs directory is the workaround found on 2026-09-27 (#28).
Where things live
-
Data:
~/.local/share/wdocker/0.15.x/(the0.15.xpart follows wdocker’s breaking version). Each conductor sits underconductors/NAME/, hApps underhapps/. -
The admin port and its allowed origin are random at each start, and written into
conductors/NAME/conductor/conductor-config.yaml. -
The conductor keeps its keystore in process (lair in process) and unlocks it with the password the daemon reads on stdin.
-
Network: bootstrap and signal at
https://bootstrap.moss.socialandwss://bootstrap.moss.social, relay athttps://iroh-relay.moss.social./(wdocker/src/const.tslines 12 to 28).
What stays interactive
The one entry point that needs no TTY is the daemon itself: wdaemon NAME reads the conductor password on stdin, which is how the package’s VM check (checks.x86_64-linux.vmTestWdocker) starts a conductor. Joining a group still needs wdocker join-group at a terminal. Moss added environment variables for a headless start later (lightningrodlabs/moss PR #224); they are not on tag v0.15.8 and this package does not carry them. The service above drives the daemon over stdin, with the password as a systemd credential, and needs neither.
Contributing
This repository is a set of NixOS modules other people are meant to run on their own hardware, so the bar is that a change is shown to work, not argued to. Everything below is about that.
Before you write anything
Open an issue describing what you want to add or change. For a new module or a new option it helps to say what the machine should end up doing, and how you would tell whether it did.
The loop
- Fork, and branch from
main. - Make the change.
- Format every
.nixfile you touched with alejandra:nix run nixpkgs#alejandra -- . - Check the flake still evaluates:
nix flake check --no-build --all-systems - Build the VM tests your change touches (see below).
- Regenerate the option reference if you changed any option (see below).
- Open a PR. Paste the commands you ran and what they printed.
Every new module needs a VM test
A module is not finished when it evaluates. nix flake check --no-build proves that the Nix expression is well typed; it proves nothing about whether the service starts, whether the binary takes the flags the module passes it, or whether the port is open. All three have been wrong here before.
So: a module that creates a service ships a pkgs.nixosTest under checks in flake.nix, and that test asserts the behaviour, not the configuration. Concretely, prefer
machine.wait_for_unit(...)andsystemctl is-activeover reading the generated unit file,- a request that returns real data over a listening socket,
- an assertion on a value the service produced over an assertion on a value the module wrote.
Where the sandbox genuinely cannot run the thing (no network, no registry), assert what the module generates, say so in a comment, and exercise the real thing by hand with the transcript in the PR. vmTestWindtunnel is the worked example of that compromise.
Add the new check to the build list in .github/workflows/ci.yml in the same commit.
Run a single test with:
nix build .#checks.x86_64-linux.<name> -L
These need KVM. On a machine without it they will be extremely slow rather than failing outright.
The option reference is generated
docs/module-options.md is built from the module declarations by nix build .#options-doc. It is committed so that it can be read on the web, and CI fails when the committed copy differs from a fresh build. Hand-editing it is therefore always wrong: the next CI run will say so.
After changing, adding or removing any option:
cp "$(nix build .#options-doc --print-out-paths)" docs/module-options.md
in the same commit as the option change. Two things make the difference between a clean regeneration and a noisy one:
- Give any option whose default is a package, a path, or anything else that lands in the Nix store a
defaultText(lib.literalExpressionorlib.literalMD). Without it the store path is written into the document and every unrelated commit rewrites it. - Write the description as the answer to “what does this do, and what happens if I get it wrong”, not as a restatement of the option name. It is the only documentation most people will read.
Prose about how the modules fit together belongs in docs/architecture.md, not in the generated file.
Documentation
Update docs/ in the same PR as the behaviour it describes. README.md has a rule of its own: every statement in it has to be true of the tree at that commit, and every ticked roadmap item cites the PR that closed it.
A change that someone running these modules would notice gets a line under ## [Unreleased] in CHANGELOG.md, under the heading that fits. A change that breaks an option, a default or a flake output goes under ### Breaking and says what to change. Maintainers cut releases as docs/releasing.md describes.
Commits and PRs
- Conventional commits (
feat(edgenode): …,fix(grafana): …,docs: …), one logical change per commit. - No AI-tool attribution lines in commit messages.
- Nothing binary and nothing secret in git. hApp bundles are fetched by hash with
pkgs.fetchurl; private keys, tokens and passphrases never enter the repository. Public SSH keys are not secrets and are committed in the example fleet on purpose. - A PR body says what commands prove the change, and what they printed.
Known upstream advisory
nix flake show --no-eval-cache prints one line, evaluation warning: crane requires at least nixpkgs-26.05, supplied nixpkgs-25.11. It is holonix main-0.6’s own crane-versus-nixpkgs advisory, surfaced because this flake re-exports packages.<system>.holochain-0_6 and hc-0_6 for 0.6 fleets; nothing this repository defines warns. A warm evaluation cache hides the line, so any check of it must pass --no-eval-cache. Do not remove the 0.6 outputs to silence it.
Licence
By contributing you agree that your work is licensed under the MIT License, the same as the rest of the repository and as nixpkgs.
Releasing
A release is a git tag on main. Pushing a tag vX.Y.Z or vX.Y.Z-rc.N starts .github/workflows/release.yml, which:
- rejects any other tag shape, and fails unless
CHANGELOG.mdhas a## [X.Y.Z](or## [X.Y.Z-rc.N]) section with content; - runs every job of
.github/workflows/ci.ymlagainst the tagged commit, VM tests included (about 25 minutes); - creates the GitHub release for the tag, with that CHANGELOG section as its text. An
-rc.Ntag becomes a prerelease, which is never shown as the latest release.
Nothing is built or uploaded: consumers pin the tag itself, as github:Sensorica/nixos-holochain/vX.Y.Z. If step 1 or 2 fails, no release is created and the tag can be deleted and pushed again once the cause is fixed.
Versions
SemVer on the public surface named at the top of CHANGELOG.md. Below 1.0.0, a minor version may break it, and every such change goes under ### Breaking in that version’s section. A release candidate vX.Y.Z-rc.N precedes each minor that a real fleet depends on.
Cut a release candidate
-
On a branch, move everything under
## [Unreleased]into a new section below it,## [0.1.0-rc.1] - YYYY-MM-DD, and leave## [Unreleased]empty above it. The whole section becomes the release note, prose included, so rewrite any paragraph that no longer holds once the tag exists; for the first candidate, that is the sentence “Nothing has been released yet.” Update the link references at the foot of the file (see below). Open a PR and merge it. -
Check the notes the release will carry, from an up to date
main:git switch main && git pull --ff-only sh scripts/changelog-section.sh 0.1.0-rc.1 -
Tag the merge commit and push the tag:
git tag -a v0.1.0-rc.1 -m "v0.1.0-rc.1" git push origin v0.1.0-rc.1 -
Watch the run under Actions, “Release”. When it is green, the prerelease is on the Releases page.
To rehearse before tagging, run the workflow by hand from the Actions tab (“Release”, “Run workflow”) with the tag name as input. It checks the tag shape, prints the notes in the run summary and runs CI on the chosen branch, and publishes nothing.
Cut a release
The same four steps with 0.1.0 in place of 0.1.0-rc.1, except for how step 1 fills the section. The ## [0.1.0] section lists everything since the previous final release, so someone upgrading from it reads one section. After a candidate, ## [Unreleased] holds only what changed since that candidate, so step 1 assembles ## [0.1.0] from the entries of every 0.1.0-rc.N section merged with what is under ## [Unreleased], and leaves the candidate sections in place below it as history. When nothing changed since the last candidate, ## [Unreleased] is empty and the new section is the candidates’ entries alone. A section left empty fails the release at its first step.
Link references
Each version heading is a link, defined at the foot of CHANGELOG.md:
[Unreleased]: https://github.com/Sensorica/nixos-holochain/compare/v0.1.0-rc.1...HEAD
[0.1.0-rc.1]: https://github.com/Sensorica/nixos-holochain/releases/tag/v0.1.0-rc.1
From the second tag on, a version links to the comparison with the one before it, for example compare/v0.1.0-rc.1...v0.1.0-rc.2.
Architecture decision records
These are the design decisions behind nixos-holochain, one file per ADR. ADR-005 to ADR-017 were first recorded in the descriptions of issues #1 (the design record for the 2026 workshop milestone) and #15 (the research record of 2026-08-28). ADR-001 to ADR-004 belong to the Phase 1 architecture design of 2026-05-13, which #1 calls “the May design doc” and whose numbering it continues; that document is not in this repository, and its ADRs are not published here. Moving them here (#39) keeps the record next to the code it explains.
| ADR | Title | Status | Date | Source |
|---|---|---|---|---|
| 001 | Not published: recorded in the May 2026 design, which is not in this repository | 2026-05-13 | May design | |
| 002 | Not published: recorded in the May 2026 design, which is not in this repository | 2026-05-13 | May design | |
| 003 | Not published: recorded in the May 2026 design, which is not in this repository | 2026-05-13 | May design | |
| 004 | Not published: recorded in the May 2026 design, which is not in this repository | 2026-05-13 | May design | |
| 005 | Fleet becomes an example | Accepted | 2026-08-28 | #1 |
| 006 | Installer on hc client call | Accepted | 2026-08-28 | #1 |
| 007 | Toolchain pins | Amended 2026-08-28 | 2026-08-28 | #1, #15 |
| 008 | Traffic and metrics | Amended 2026-08-28 | 2026-08-28 | #1, #15 |
| 009 | HTTP gateway | Amended 2026-08-28 | 2026-08-28 | #1, #15 |
| 010 | Stack shape | Accepted | 2026-08-28 | #1 |
| 011 | CI policy | Accepted | 2026-08-28 | #1 |
| 012 | Nothing binary or secret in git | Amended 2026-08-28 | 2026-08-28 | #1 |
| 013 | Hardware-bound acceptance stays with the principal | Accepted | 2026-08-28 | #1 |
| 014 | Verification modality | Accepted | 2026-08-28 | #1 |
| 015 | The Sensorica fleet pins 0.6.3 for the September workshop | Accepted | 2026-08-28 | #15 |
| 016 | Passphrase and readiness follow Holo’s module | Accepted | 2026-08-28 | #15 |
| 017 | HoloPort is a legacy-BIOS x86_64 target | Accepted | 2026-08-28 | #15 |
Every ADR number that the repository, #1 or #15 refers to from 005 to 017 has its text here. ADR-001 to ADR-004 are cited only by number: in #1, which continues their numbering, and in the title of #8 (ADR-003).
How to read a file
Each file has a Status, a Date, a Source, then Context, Decision and Consequences. Text in a quote block is copied from #1 or #15 as written, and the context is taken from the same issue. Where the source gives no context or consequence for a decision, the file says so rather than supplying one.
- Amendments are recorded inside the ADR they change, with their date, below the original decision. The original text stays.
- Later record lists what happened after the decision where it bears on it: a ruling in a PR review, or a place where
mainno longer matches the recorded text and the record was not amended. Each entry links its evidence. These entries are observations, not new decisions.
In #1 and #15, “the principal” is @Soushi888, “PM” and “Builder” are the two roles of the paired sessions that built the 2026 stack, and a “slice” is one PR of that stack.
What stays in the issues
Issue #1 also records working rules for the 2026 PM/Builder sessions (draft PRs, where a bug found in a slice gets fixed, commit cadence) and the open questions of that milestone. They are process for one milestone, not numbered decisions, so they stay in the issue. Issue #15 is also a research record of the Holochain ecosystem as of 2026-08-28; only its decisions are copied here.
ADR-005: Fleet becomes an example
- Status: Accepted
- Date: 2026-08-28
- Source: #1, issue description, section “Decisions (ADRs, continuing the numbering of the May design doc)”
Context
From the state of the repository recorded in #1 when the decision was taken (verified 2026-08-28):
nix flake check --no-buildfails: everyhosts/edgenode-0*/configuration.niximports ahardware-configuration.nixthat is not in the tree. CI has failed on both pushes (runs 25826332473, 25826848922).
colmenaoutput declares nodes without importing any module.
Decision
The Sensorica fleet (5 hosts + workshop ISO + colmena hive) moves to
examples/sensorica-fleet/with its ownflake.nixthat takes the root flake as input. The root flake keeps modules, templates and VM checks only, so a community user never evaluates Sensorica hosts. Committedhardware-configuration.nixstubs make each host evaluate; the example README documents replacing them withnixos-generate-configoutput.
Consequences
The record states no consequences beyond the decision itself.
ADR-006: Installer on hc client call
- Status: Accepted
- Date: 2026-08-28
- Source: #1, issue description, section “Decisions (ADRs, continuing the numbering of the May design doc)”
Context
From the state of the repository recorded in #1 when the decision was taken (verified 2026-08-28):
The hApp installer in
modules/holochain-edgenode.nixcallshc app install,hc app enableandhc app attach-interface. None exist. In the pinned holonix (revd49ebd5e7a, Holochain0.7.0-dev.24),hc apphas onlyinit | pack | unpack | schema. The admin calls live underhc client call --port <admin-port> install-app | enable-app | add-app-ws | list-apps | dump-network-stats | dump-network-metrics.
Decision
The hApp installer service uses
hc client call --port ${adminPort} install-app,enable-app,add-app-ws, verified against the real binary in a NixOS VM test. The May design’s Node.js fallback (§4.5) is dropped.
The May design and its §4.5 are not in this repository. §4.5 was the Node.js fallback (a helper using @holochain/client) of the May design’s installer decision, ADR-004, which is not published here (see the index).
Consequences
The record states no consequences beyond the decision itself.
Later record
- On the 0.6 line, which ADR-007 as amended added, the same admin calls run under
hc sandbox call --running <adminPort>: the 0.6.3hchas noclientsubcommand. This is recorded in #16 and re-derived in its review, and it is whatmodules/holochain-edgenode.nixdoes onmain.
ADR-007: Toolchain pins
- Status: Amended (2026-08-28, dual-line)
- Date: 2026-08-28
- Source: #1, issue description, section “Decisions (ADRs, continuing the numbering of the May design doc)”; amendment from #15, issue description, section “6. Decisions (ADR amendments, effective now)”, copied into #1 under “Amendments from the research record”
Context
From the state of the repository recorded in #1 when the decision was taken (verified 2026-08-28):
Holochain 0.7.0 is released; holonix branch
main-0.7is the target. The lock pinsmainfrom May, which resolved to a dev build.
Decision
holonix input is
github:holochain/holonix/main-0.7. nixpkgs isnixos-25.05to matchsystem.stateVersion, unless a required module only exists on unstable, in which case the Builder records the reason in the PR and bumpsstateVersionconsistently.
Consequences
The record states no consequences beyond the decision itself.
Amendments
2026-08-28: the module is dual-line
From #15, section 6:
Root inputs
holonix(main-0.7, the default package) andholonix-0_6(main-0.6, 0.6.3). The module renders the conductornetworksection from the package version:lib.versionOlder cfg.package.version "0.7"→bootstrap_url+signal_url(0.6, kitsune2/sbd; production defaults taken from edgenode’sconductor-config-0.6.1.template.yaml); otherwisebootstrap_url+relay_url(0.7, Iroh; defaults fromholochain --create-config). OptionsignalUrlstays for 0.6 and is ignored with a warning on 0.7; new optionrelayUrl. Both lines get a VM smoke test (vmTest,vmTest-0_6) and a hApp test (vmTestWithHappwith Dino Adventure v0.3.0 on 0.7;vmTestWithHapp-0_6with Kando v0.17.5 or hREA happ-0.4.0-beta on 0.6), all fetched by sha256. Reason: the release train is 0.7 and that is what a community user adopting the module next month should get by default, while every hApp with real content still targets 0.6.x; a module that serves only one line serves nobody in September 2026.
Its context, from #15 section 1: Holochain 0.7.0 was released 2026-07-30 with Iroh over QUIC as the only transport (signal_url must be removed from conductor configs) and no data migration from 0.6.
Later record
- 0.6 network section. #16 found that a 0.6.3 conductor given only
bootstrap_url+signal_urlrefuses to start withnetwork: missing field 'relay_url', so the module rendersbootstrap_url+signal_url+relay_urlbelow 0.7 andbootstrap_url+relay_urlfrom 0.7. The review re-derived this from edgenode’s 0.6.1 template. #1 was not amended. - nixpkgs. #20 moved the root flake, both templates and the example to
nixos-26.05, withsystem.stateVersion = "26.05", becausenixos-25.05reached end of life. #1 was not amended;flake.nixonmainpinsnixos-26.05.
ADR-008: Traffic and metrics
- Status: Amended (2026-08-28, the runner is compute donation)
- Date: 2026-08-28
- Source: #1, issue description, section “Decisions (ADRs, continuing the numbering of the May design doc)”; amendment from #15, issue description, section “6. Decisions (ADR amendments, effective now)”, copied into #1 under “Amendments from the research record”
Context
From the state of the repository recorded in #1 when the decision was taken (verified 2026-08-28):
holochain-windtunnel,holochain-http-gatewayandpaimodules arewarnings = [...]placeholders.
#1 also left open, with an owner, “Whether the Wind Tunnel runner is the workshop’s traffic source or Moss on laptops: PM, after slice 3 shows what the dashboard looks like.”
Decision
The Wind Tunnel module runs the Foundation’s
ghcr.io/holochain/wind-tunnel-runnerimage throughvirtualisation.oci-containers(host network, privileged,nomad-client-<hostname>naming as in Sensorica’s April plan). Conductor-level metrics come from our own systemd timer that writeshc client call dump-network-statsoutput to a node_exporter textfile. A native Wind Tunnel package is out of scope.
Consequences
The record states no consequences beyond the decision itself.
Amendments
2026-08-28: the Wind Tunnel runner is compute donation, not the dashboard’s traffic
From #15, section 6:
The
ghcr.io/holochain/wind-tunnel-runnercontainer runs its own conductor and reports to the Foundation’s Nomad/InfluxDB, and its README calls it internal-use. The module keeps it as an opt-in (services.holochain-windtunnel.enable, default off, documented as “donate this machine to the Foundation’s test cluster”) and the Grafana dashboard’s traffic comes from our conductor stats exporter (hc client call dump-network-stats→ textfile → node_exporter) plus real participant activity on the fleet’s hApps. No local Wind Tunnel scenario runs in scope (the tagged scenarios target 0.6.3 and the nightly 0.7 ones are unreleased).
Consequence recorded in #15, section 7, for slice 3 (#4): “Wind Tunnel runner opt-in and off by default; the dashboard’s holochain_* gauge becomes the primary criterion.”
ADR-009: HTTP gateway
- Status: Amended (2026-08-28, built from source per line)
- Date: 2026-08-28
- Source: #1, issue description, section “Decisions (ADRs, continuing the numbering of the May design doc)”; amendment from #15, issue description, section “6. Decisions (ADR amendments, effective now)”, copied into #1 under “Amendments from the research record”
The title in #1 is “HTTP gateway is hc http-gw”; the amendment replaced that choice, so this file keeps the subject as its title.
Context
From the state of the repository recorded in #1 when the decision was taken (verified 2026-08-28):
The same
hcbuild ships anhc http-gwextension (needsHC_GW_ADMIN_WS_URL).
holochain-windtunnel,holochain-http-gatewayandpaimodules arewarnings = [...]placeholders.
Decision
The gateway module wraps the extension shipped with holonix’s
hc, configured from the module’sadminPortandlistenPort.
Consequences
The record states no consequences beyond the decision itself.
Amendments
2026-08-28: the gateway is built from source per line
From #15, section 6:
holochain_http_gatewayv0.4.x for 0.7, v0.3.x for 0.6, packaged withrustPlatform.buildRustPackagefrom the tagged source (Cargo.lock present), never thehc http-gwbundled in holonix’shc. Module options mirror spec.md (allowedAppIds,allowedFnsper app,payloadLimitBytes,maxAppConnections,zomeCallTimeoutMs,address,port); default exposes nothing. Reference implementation: Holo-Host/holo-hostnix/modules/nixos/hc-http-gw.
Its context, from #15 section 2: hc-http-gw publishes one release line per Holochain line (0.6.x → 0.3.x, 0.7.x → 0.4.x), and “The hc http-gw bundled in holonix main-0.7’s hc reports crate 0.3.1: wrong line for 0.7, do not use it.”
Consequence recorded in #15, section 7, for slice 4 (#5): “gateway from source per line with the spec.md options”.
Later record
- docs/architecture.md § Not the bundled
hc http-gwdescribes the build onmainand the release pinned for each line.
ADR-010: Stack shape
- Status: Accepted
- Date: 2026-08-28
- Source: #1, issue description, section “Decisions (ADRs, continuing the numbering of the May design doc)”
Context
From #1:
This epic is the design record for the
Workshop 2026milestone. It is owned by the PM session of a PM/Builder binôme: the PM decides, decomposes and verifies; the Builder implements in stacked PRs.
Decision
Trunk is
main. Five slices, each a PR based on the previous slice’s branch:slice/1-flake-evaluates→slice/2-conductor-happ→slice/3-observability→slice/4-community-shape→slice/5-workshop-kit. The principal squash-merges in order; after each merge the next slice is rebased ontomainand its PR base edited.
Consequences
The record states no consequences beyond the decision itself.
Related record in #1
#1 records the slice order, the gate and an amendment to the gate in their own sections, not as part of ADR-010. They are copied here because they describe the same stack.
The slice order, from #1, section “Slice order (a real dependency chain)”:
| Slice | Branch | Base | Closes |
|---|---|---|---|
| 1 Flake evaluates, fleet as example, toolchain on 0.7, CI green | slice/1-flake-evaluates | main | evaluation, layout, pins, CI |
| 2 Conductor and hApp at boot, VM-tested | slice/2-conductor-happ | slice 1 | the module actually works |
| 3 Observability: fleet traffic on Grafana | slice/3-observability | slice 2 | the workshop’s high point |
| 4 Community shape: templates, gateway, truthful docs | slice/4-community-shape | slice 3 | reuse by strangers |
| 5 Workshop kit: ISO, fleet runbook, materials, two-node fleet test | slice/5-workshop-kit | slice 4 | the day itself |
Slice 2 depends on 1 (the flake must evaluate before a VM test can build). 3 depends on 2 (metrics need a running conductor). 4 depends on 3 (README truth needs the modules real). 5 depends on 4 (materials reference the final layout and template).
The gate, from #1, section “Gate”:
The child slice’s PR is published only after the parent’s PR carries a
PM review: APPROVEcomment and the child branch contains the parent’s current head (git merge-base --is-ancestor <parent> HEAD). Local work ahead of the verdict is fine; publishing it is not.
The amendment to the gate, from #1, section “Amendments”, entry timed 01:58 (the entry names the gate, not ADR-010):
Verdicts are PR comments, not GitHub review approvals: both sessions act under the principal’s account and GitHub refuses “approve your own pull request”. The gate reads the
PM review: APPROVEcomment; the principal’s merge is the release.
Later record
- The stack landed as seven slices, not five: #13, #16, #17, #18, #19, then
slice/6-nixos-26.05(#20) andslice/7-review-hardening(#21). All seven were merged on 2026-09-26 with merge commits (git log --mergesonmain), not squash-merged. #1 was not amended.
ADR-011: CI policy
- Status: Accepted
- Date: 2026-08-28
- Source: #1, issue description, section “Decisions (ADRs, continuing the numbering of the May design doc)”
Context
From the state of the repository recorded in #1 when the decision was taken (verified 2026-08-28):
nix flake check --no-buildfails: everyhosts/edgenode-0*/configuration.niximports ahardware-configuration.nixthat is not in the tree. CI has failed on both pushes (runs 25826332473, 25826848922).
Decision
Eval jobs run on every push. VM tests are built in CI from slice 2 on (the workflow already enables KVM on
ubuntu-latest). If the runner cannot build them, the PR says so with the run link and the PM re-derives the tests locally before any verdict.
Consequences
The record states no consequences beyond the decision itself.
ADR-012: Nothing binary or secret in git
- Status: Amended (2026-08-28, SSH public keys are committed)
- Date: 2026-08-28
- Source: #1, issue description, section “Decisions (ADRs, continuing the numbering of the May design doc)”; amendment from the section “Amendments” of the same description
Context
From the state of the repository recorded in #1 when the decision was taken (verified 2026-08-28):
happs/is empty and*.happis gitignored.
Decision
hApp bundles are fetched by hash (
pkgs.fetchurl), never committed. SSH public keys stay under the gitignoredsecrets/with a committed.example.
Consequences
The record states no consequences beyond the decision itself.
Amendments
2026-08-28: SSH public keys are committed
From #1, section “Amendments”, entry timed 01:45:
ADR-012 revised. SSH public keys are not secrets: the example commits the operator public keys in
examples/sensorica-fleet/hosts/common.nix(users.users.sensorica.openssh.authorizedKeys.keys, placeholder line for the operator to paste theirs). Reason: a flake only sees git-tracked files, so a gitignoredsecrets/sensorica.pubbehindbuiltins.pathExistsis never in the evaluated source and the fleet would deploy with no authorized key. Private keys, tokens and passphrases never enter git; that half stands. Detail: interim review comment on #2.
Later record
- Documentation images. The slice 3 review ruled on 2026-08-28 (#17 review): “a PNG under
docs/images/is documentation, not a hApp bundle or a secret; it is allowed. Keep such images small and dated, as this one is.”
ADR-013: Hardware-bound acceptance stays with the principal
- Status: Accepted
- Date: 2026-08-28
- Source: #1, issue description, section “Decisions (ADRs, continuing the numbering of the May design doc)”; the list of hardware-bound issues is the section “Hardware-bound issues (not slices)” of the same description
“The principal” in the record is @Soushi888.
Context
From #1:
This epic is the design record for the
Workshop 2026milestone. It is owned by the PM session of a PM/Builder binôme: the PM decides, decomposes and verifies; the Builder implements in stacked PRs.
Decision
Criteria that need a Holoport, the lab router or a participant are separate issues assigned to @Soushi888. The Builder closes only what a VM or CI can prove.
Consequences
From #1, section “Hardware-bound issues (not slices)”:
Holoport vanilla NixOS boot test, dedicated router,
colmena applyon the physical fleet, rollback demo on hardware, facilitator guide review with Tibi, preflight sent seven days out, and the workshop date itself. Each is its own issue, assigned to @Soushi888, labelledhardware.
ADR-014: Verification modality
- Status: Accepted
- Date: 2026-08-28
- Source: #1, issue description, section “Decisions (ADRs, continuing the numbering of the May design doc)”
Context
From #1:
This epic is the design record for the
Workshop 2026milestone. It is owned by the PM session of a PM/Builder binôme: the PM decides, decomposes and verifies; the Builder implements in stacked PRs.
Decision
Every acceptance criterion names the command that proves it. PR bodies carry a
How to testline the PM runs verbatim, plus the numbers it printed. A criterion without a reproducible command is a defect in this doc, not in the review.
Consequences
The record states no consequences beyond the decision itself.
ADR-015: The Sensorica fleet pins 0.6.3 for the September workshop
- Status: Accepted
- Date: 2026-08-28
- Source: #15, issue description, section “6. Decisions (ADR amendments, effective now)”; summarised in #1 under “Amendments from the research record”
“The principal” in the record is @Soushi888.
Context
From #15, section 6, the reason given for ADR-007 as amended:
the release train is 0.7 and that is what a community user adopting the module next month should get by default, while every hApp with real content still targets 0.6.x
#15, section 3, lists the downloadable bundles per line: on 0.7.0, Dino Adventure v0.3.0 and Moss group.happ 0.16-dev.3; on 0.6.x, hREA happ-0.4.0-beta, Kando v0.17.5, Requests & Offers v0.5.2 (.webhapp only) and others.
Decision
ADR-015 (new): the Sensorica fleet pins 0.6.3 for the September workshop, with hREA happ-0.4.0-beta, Kando v0.17.5 and Requests & Offers v0.5.2 (unpacked) as the fleet’s hApps, Kando desktop and Moss 0.15.8 on participants’ laptops for the “join from your laptop” step. Dino Adventure stays the 0.7 CI fixture. Re-evaluated seven days before the date: if Moss 0.16 is stable and hREA or R&O have shipped 0.7 bundles by then, the example flips to 0.7. The principal can override this pin at any time; it is a workshop decision, not a module decision.
Consequences
From #15, section 7, for slice 5 (#6): “fleet hApps per ADR-015; participant laptop step uses Kando desktop / Moss 0.15.8”.
From #15, section 8, open question: “Whether the principal wants the fleet on 0.7 regardless of the thin hApp menu (ADR-015 is reversible with one line).”
ADR-016: Passphrase and readiness follow Holo’s module
- Status: Accepted
- Date: 2026-08-28
- Source: #15, issue description, section “6. Decisions (ADR amendments, effective now)”; summarised in #1 under “Amendments from the research record”
Context
From #15, section 5:
Holo-Host/holo-host
nix/modules/nixos/holochain/default.nix(pushed 2026-07-03): options underholo.holochain, default package holonix 0.5 (behind),passphraseFilegenerated withpwgeninpreStart,holochain --piped --config-path … < passphrase,Type = "notify"(the conductor doessd_notify),StateDirectorymode 0700,Restart = always. A siblinghc-http-gw/module exists next to it. This is the closest prior art and the reference for our passphrase and readiness handling.
Decision
Slice 2 generates the lair passphrase in
preStartinto$STATE_DIRECTORY(mode 0600,pwgenoropenssl rand), feeds it withholochain --piped < file, usesType = "notify"(verify the conductor’ssd_notifyin the VM; fall back to the port poll only if it does not fire),StateDirectory0700. Credit Holo-Host/holo-host indocs/architecture.md.
Consequences
From #15, section 7, for slice 2 (#3): “passphrase per ADR-016”.
Later record
- #16 reports
Type = "notify"proven in the VM (systemd printsStarted Holochain conductor.only after the conductor’s readiness signal), so the port-poll fallback was not needed. Onmain,modules/holochain-edgenode.nixruns the conductor asType = "notify"by default through theuseSystemdNotifyoption, withType = "simple"when it is set to false. - The credit is in docs/architecture.md § The lair passphrase and readiness.
ADR-017: HoloPort is a legacy-BIOS x86_64 target
- Status: Accepted
- Date: 2026-08-28
- Source: #15, issue description, section “6. Decisions (ADR amendments, effective now)”; summarised in #1 under “Amendments from the research record”
Context
From #15, section 4 (HoloPort hardware, issue #8):
Firmware boots legacy BIOS/MBR: HolOS builds GRUB
i386-pconly (buildroot config); the 2019 HoloPortOS used GRUB on the raw disk; Holochain’s runner installer partitions GPT with abios_grubpartition plus a vfat ESP and installs GRUB withefiInstallAsRemovable(installer.nix, base-install.nix). UEFI availability and Secure Boot: unknown, nothing published; check the setup screen. BIOS key: undocumented (try Del/F2, boot menu F7/F8/F11/F12).
No DMI/SMBIOS data on the board (Holo’s own detection keys on a CH340 USB-serial LED controller); disks are
/dev/sda(+/dev/sdbon the +); NIC at PCI0000:01:00.0; VGA framebuffer console, so HDMI + USB keyboard is the normal path.
Decision
Hardware stubs and the runbook (slice 5) adopt the wind-tunnel-runner layout: GPT with a 1 MiB
bios_grubpartition, a vfat ESP labelledboot, ext4 root labellednixos, swap labelledswap;boot.loader.grubwithdevice = "nodev",efiSupport = true,efiInstallAsRemovable = true, which boots on both firmware modes. The workshop ISO stays the hybrid NixOS installer image (bootable on BIOS and UEFI). The runbook states: HDMI + USB keyboard, Ethernet only, disk/dev/sda, RAM 8 GB on the base model, no DMI data, BIOS keys to be found on the box. Issue #8 carries the checklist.
Consequences
From #15, section 7, for slice 5 (#6): “stub layout per ADR-017”. Issue #8 was updated with the BIOS checklist.
From #15, section 8, open question: “Whether the HoloPort firmware offers UEFI or Secure Boot: only the box can answer (#8).”
Later record
- #21 moved the boot loader out of the hardware stubs, because
nixos-generate-configoutput never contains one: it now lives inhosts/common.nixof the#fleettemplate and of the example, so the stubs describe filesystems only. The#minimaltemplate targets a stock NixOS UEFI install with systemd-boot, and a comment in itsconfiguration.nixgives the GRUB lines for legacy BIOS. The Holoport layout of this ADR stays with#fleetand the example. - #61 wrote the install sequence of this decision as one script,
scripts/holoport-install.sh, published aspackages.x86_64-linux.holoport-install: the layout above with 8 GiB of swap at the end of the disk,nixos-install, thengrub-install --target=i386-pcfor the BIOS half, while NixOS writes the EFI half fromhosts/common.nix.checks.x86_64-linux.vmTestHoloportInstallruns it on an empty SATA disk and boots that disk under SeaBIOS, which is legacy BIOS like the Holoport. The runbook is docs/deployment.md § Installing on a Holoport (legacy BIOS). - The first install on a real Holoport,
sensorica-holoport-01on 2026-09-27, came intomainwith #67. The runbook records what it showed: Esc at power-on opens the base HoloPort’s firmware boot menu, its live system reads the stick reliably only from a USB 2 port, and a graphical desktop freezes on its Intel HD 610. The BIOS setup key, and whether UEFI or Secure Boot exist, are still unknown, so the open question above stands and issue #8 is open.
Archive — December 2025 HolOS Workshop
Original HolOS-based workshop, December 2025. Preserved for context. Current workshop uses NixOS — see workshop/facilitator-guide.md.
The December 2025 event at Sensorica lab installed HolOS and edgenode on 5 Holoports. Key lessons learned are captured in the facilitator guide for the 2026 NixOS workshop.
Original files from Sensorica/holoports-workshop (archived) will be placed here if migrated.